![]()
See this visualization first on the Voronoi app.
Use This Visualization
Mapped: U.S. Housing Affordability by State
This was originally posted on our Voronoi app. Download the app for free on iOS or Android and discover incredible data-driven charts from a variety of trusted sources.
Key Takeaways
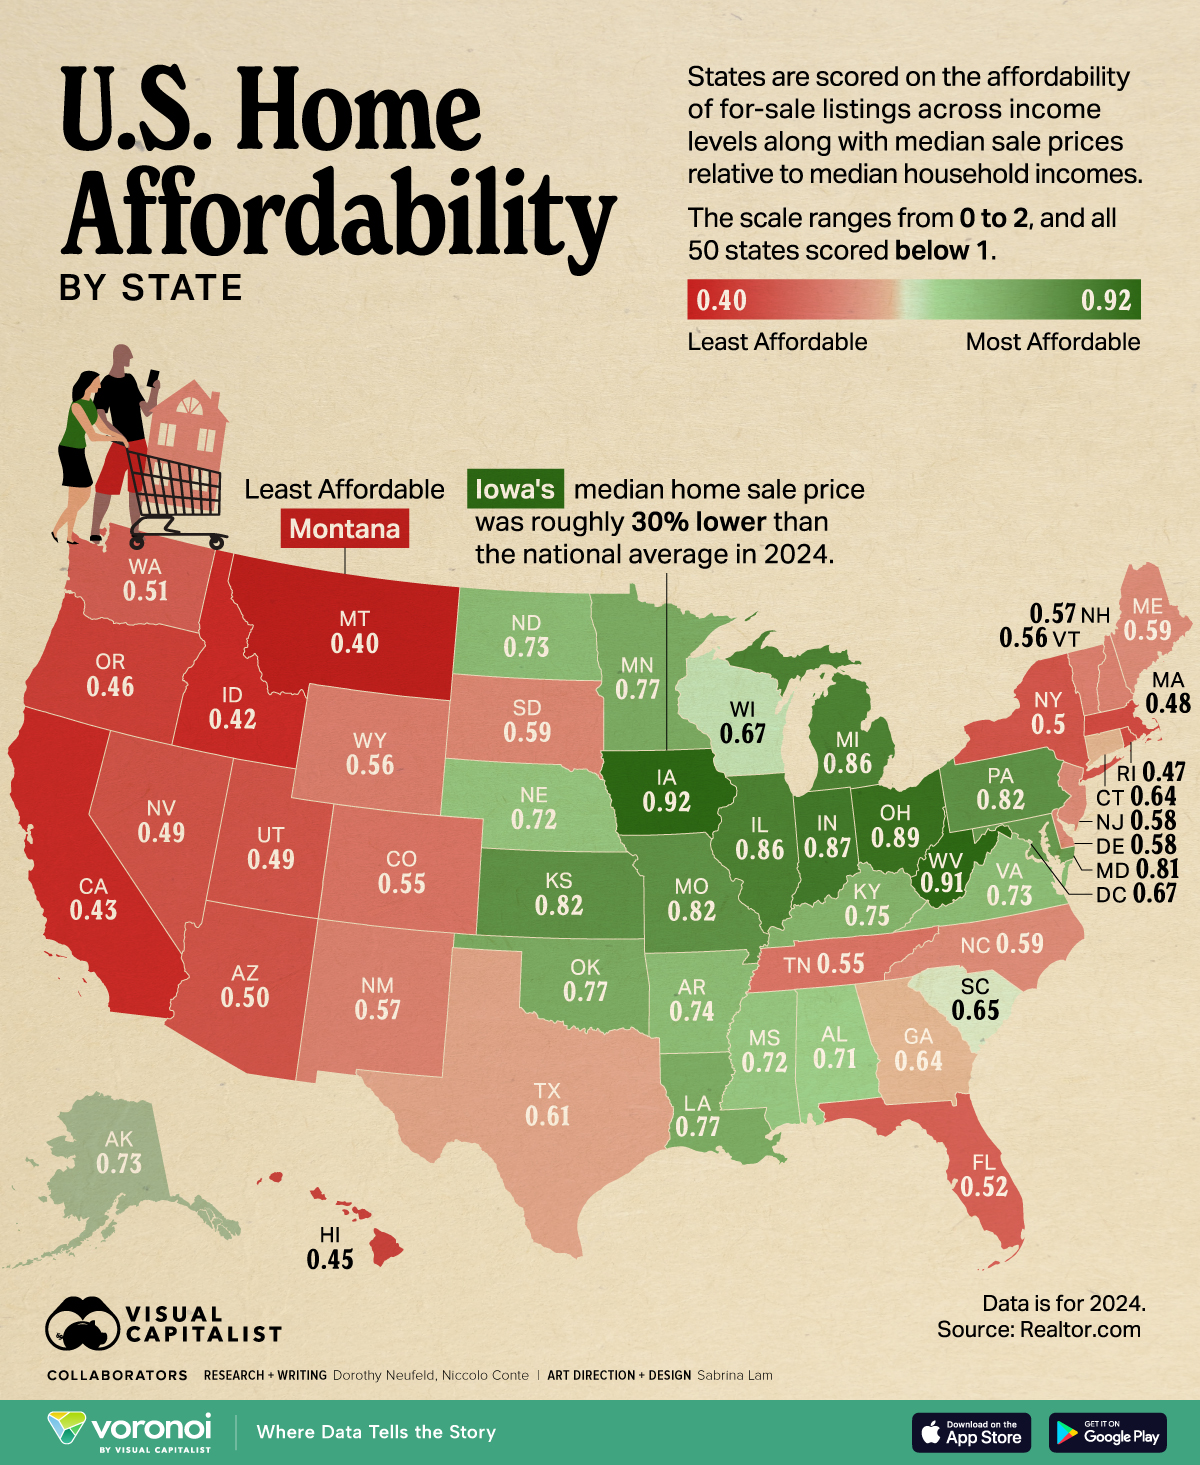
- Montana has the worst housing affordability in the U.S., driven by an influx of new residents from coastal states and a shortage of affordable homes.
- In Columbus, Ohio there are less affordable housing units per capita than in New York and San Francisco—contributing to the states’ affordability crisis.
- Iowa is the country’s most affordable state, with a median listing price of $294,600 and a median salary of $77,132.
Today, there is a housing shortage of four million homes in America, contributing to the growing affordability crisis.
South Carolina leads the nation in building homebuilding activity, but its affordability score falls near the middle of the pack. Meanwhile, Texas is ramping up residential construction, accounting for 15.3% of permits in 2024 to address the shortage of affordable homes.
This graphic shows home affordability by state in 2024, based on analysis from Realtor.com.
Methodology
For the analysis, home affordability scores took into account the affordability of for-sale listings across the income spectrum. In addition, states were assessed based on the median home sales price compared to the median income of households.
Ranked: Housing Affordability by State in 2024
Below, we rank states based on their home affordability scores, from the most affordable to least in the nation:
| State | Home Affordability Score 2024 |
|---|---|
| Iowa | 0.92 |
| West Virginia | 0.91 |
| Ohio | 0.89 |
| Indiana | 0.87 |
| Illinois | 0.86 |
| Michigan | 0.86 |
| Kansas | 0.82 |
| Missouri | 0.82 |
| Pennsylvania | 0.82 |
| Maryland | 0.81 |
| Minnesota | 0.77 |
| Louisiana | 0.77 |
| Oklahoma | 0.77 |
| Kentucky | 0.75 |
| Arkansas | 0.74 |
| Virginia | 0.73 |
| North Dakota | 0.73 |
| Alaska | 0.73 |
| Nebraska | 0.72 |
| Mississippi | 0.72 |
| Alabama | 0.71 |
| Wisconsin | 0.67 |
| District of Columbia | 0.67 |
| South Carolina | 0.65 |
| Georgia | 0.64 |
| Connecticut | 0.64 |
| Texas | 0.61 |
| North Carolina | 0.59 |
| South Dakota | 0.59 |
| Maine | 0.59 |
| Delaware | 0.58 |
| New Jersey | 0.58 |
| New Mexico | 0.57 |
| New Hampshire | 0.57 |
| Vermont | 0.56 |
| Wyoming | 0.56 |
| Tennessee | 0.55 |
| Colorado | 0.55 |
| Florida | 0.52 |
| Washington | 0.51 |
| Arizona | 0.50 |
| New York | 0.50 |
| Utah | 0.49 |
| Nevada | 0.49 |
| Massachusetts | 0.48 |
| Rhode Island | 0.47 |
| Oregon | 0.46 |
| Hawaii | 0.45 |
| California | 0.43 |
| Idaho | 0.42 |
| Montana | 0.40 |
Iowa ranks as the most affordable state in the nation, with a median listing price of $294,600.
Overall, its home price to income ratio is among the lowest nationally, at 3.0. Despite single family home prices rising by 40% since 2020, prices remain affordable. Not only that, local jurisdictions in the state have issued more than 10,000 new housing permits annually since 2022.
By contrast, states with the lowest affordability scores included Montana, Idaho, and California.
In Montana, home prices have shot up 66% in the past four years—surpassing the 50% national average. As many have flocked to the state, it has drove up prices higher while wage increases have stagnated leading to a growing affordability crisis.
Learn More on the Voronoi App ![]()
To learn more about this topic from a global perspective, check out this graphic on trends in home affordability since 2015 across OECD countries.