![]()
See this visualization first on the Voronoi app.
Use This Visualization
The States With the Highest (and Lowest) Auto Debt
This was originally posted on our Voronoi app. Download the app for free on iOS or Android and discover incredible data-driven charts from a variety of trusted sources.
Key Takeaways
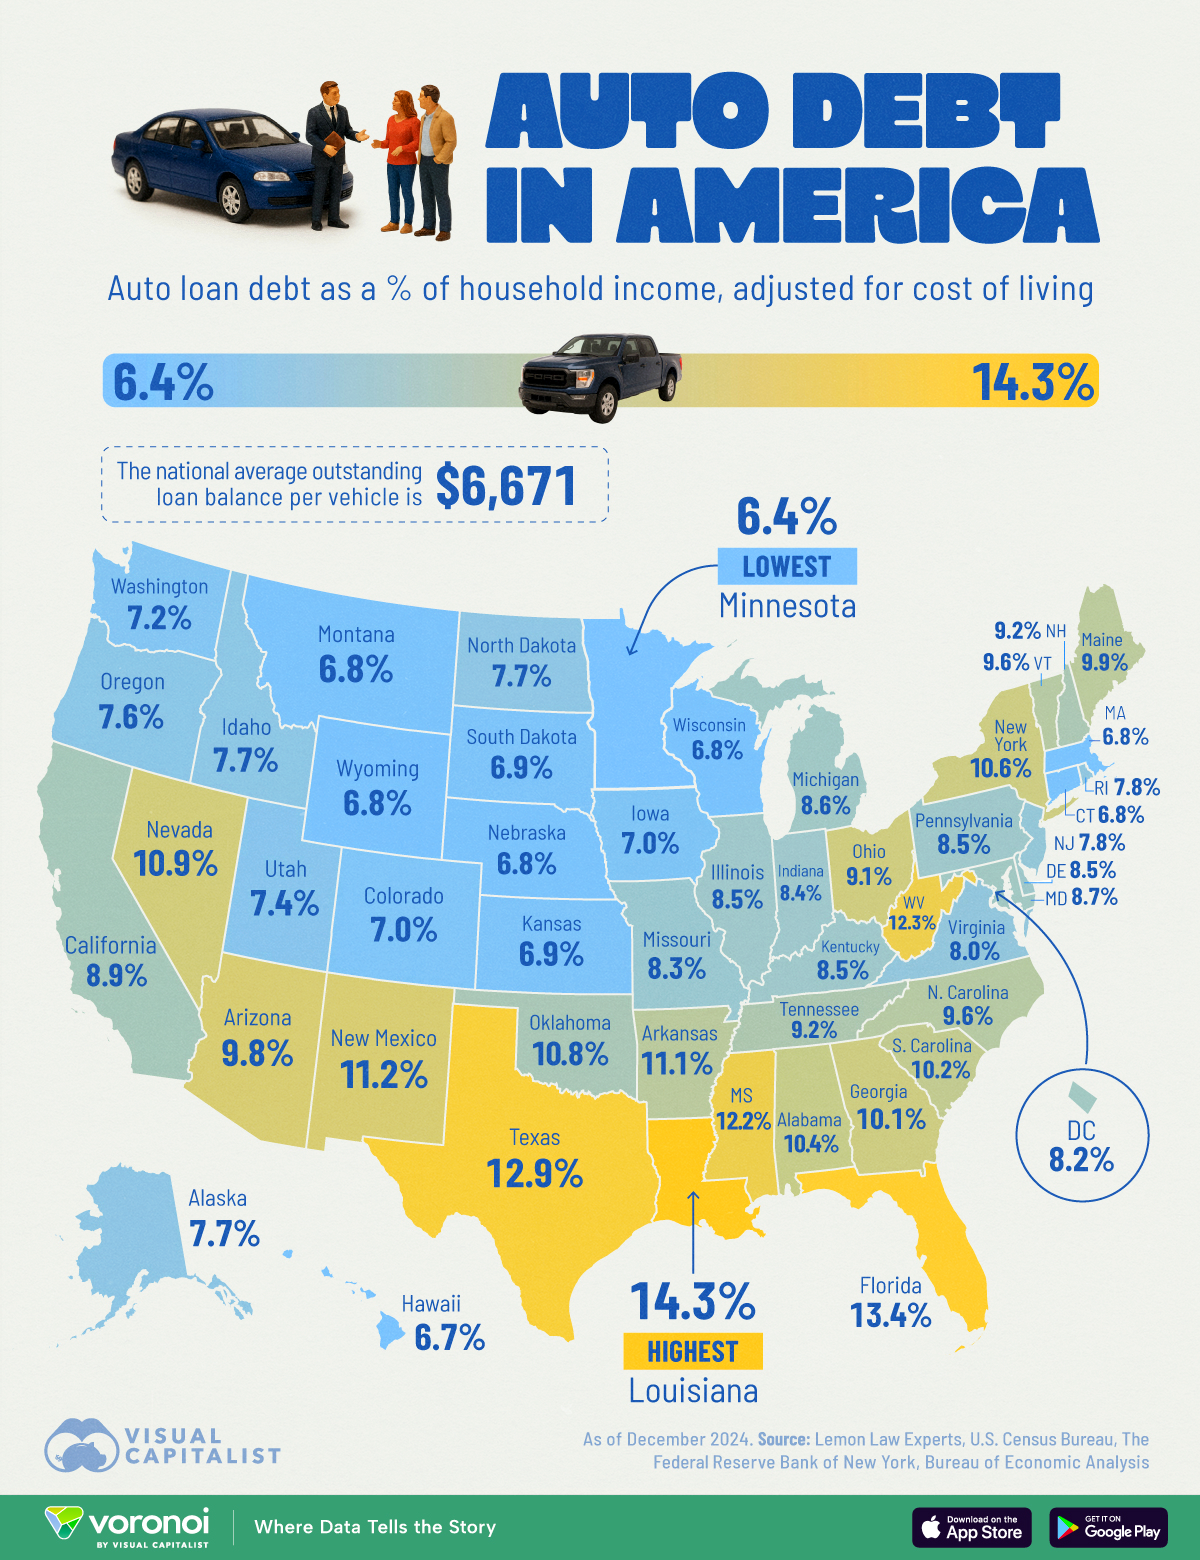
- Louisiana, Florida, and Texas have the highest auto loan balances relative to income.
- Massachusetts, Hawaii, and Minnesota have the lowest auto debt-to-income ratios.
Americans are spending more on car payments than ever, and for many, those loans represent a significant portion of their income.
This visualization breaks down auto loan balances as a percentage of income across all U.S. states.
The data for this visualization comes from Lemon Law Experts. This analysis combines Federal Reserve auto loan data with U.S. Census figures on household vehicle ownership to estimate average loan balances per vehicle. To ensure fair state-by-state comparisons, values were adjusted for cost of living using Bureau of Economic Analysis regional price parities before calculating each state’s auto debt-to-income ratio.
Southern States Top the Auto Debt Rankings
Louisiana leads the nation with an auto debt-to-income ratio of 14.33%, followed closely by Florida (13.39%) and Texas (12.88%).
These states also rank among the highest in terms of average loan amounts per vehicle. Warm climates, long commutes, and car-centric infrastructure contribute to the trend.
| Rank | State | Auto Debt to Income |
|---|---|---|
| 1 | Louisiana | 14.33% |
| 2 | Florida | 13.39% |
| 3 | Texas | 12.88% |
| 4 | West Virginia | 12.32% |
| 5 | Mississippi | 12.23% |
| 6 | New Mexico | 11.18% |
| 7 | Arkansas | 11.14% |
| 8 | Nevada | 10.87% |
| 9 | Oklahoma | 10.75% |
| 10 | Georgia | 10.66% |
| 11 | New York | 10.59% |
| 12 | Alabama | 10.39% |
| 13 | South Carolina | 10.20% |
| 14 | Maine | 9.85% |
| 15 | Arizona | 9.81% |
| 16 | Vermont | 9.64% |
| 17 | North Carolina | 9.63% |
| 18 | Tennessee | 9.22% |
| 19 | New Hampshire | 9.15% |
| 20 | Ohio | 9.05% |
| 21 | California | 8.94% |
| 22 | Maryland | 8.67% |
| 23 | Michigan | 8.63% |
| 24 | Illinois | 8.54% |
| 25 | Delaware | 8.49% |
| 25 | Kentucky | 8.49% |
| 25 | Pennsylvania | 8.49% |
| 28 | Indiana | 8.43% |
| 29 | Missouri | 8.30% |
| 30 | District of Columbia | 8.23% |
| 31 | New Jersey | 8.08% |
| 32 | Virginia | 7.97% |
| 33 | Rhode Island | 7.83% |
| 34 | Alaska | 7.70% |
| 34 | North Dakota | 7.70% |
| 36 | Idaho | 7.65% |
| 37 | Oregon | 7.57% |
| 38 | Utah | 7.38% |
| 39 | Washington | 7.20% |
| 40 | Iowa | 7.04% |
| 41 | Colorado | 7.02% |
| 42 | South Dakota | 6.93% |
| 43 | Kansas | 6.92% |
| 44 | Montana | 6.84% |
| 45 | Nebraska | 6.82% |
| 46 | Wisconsin | 6.80% |
| 47 | Connecticut | 6.78% |
| 47 | Wyoming | 6.78% |
| 49 | Massachusetts | 6.76% |
| 50 | Hawaii | 6.73% |
| 51 | Minnesota | 6.40% |
Northeastern and Upper Midwestern States Have Lowest Debt Burdens
Minnesota (6.40%), Hawaii (6.73%), and Massachusetts (6.76%) have the lowest auto debt-to-income ratios. These states typically have higher average incomes and some also count with better public transportation infrastructure, reducing reliance on expensive personal vehicles.
The National Picture: Averages and Outliers
Nationally, the average outstanding loan balance per vehicle stands at $6,671. Many states fall near this benchmark, but the spread from top to bottom is substantial.
Learn More on the Voronoi App ![]()
If you enjoyed today’s post, check out Which U.S. are the Best to do Business in? on Voronoi, the new app from Visual Capitalist.