![]()
See this visualization first on the Voronoi app.
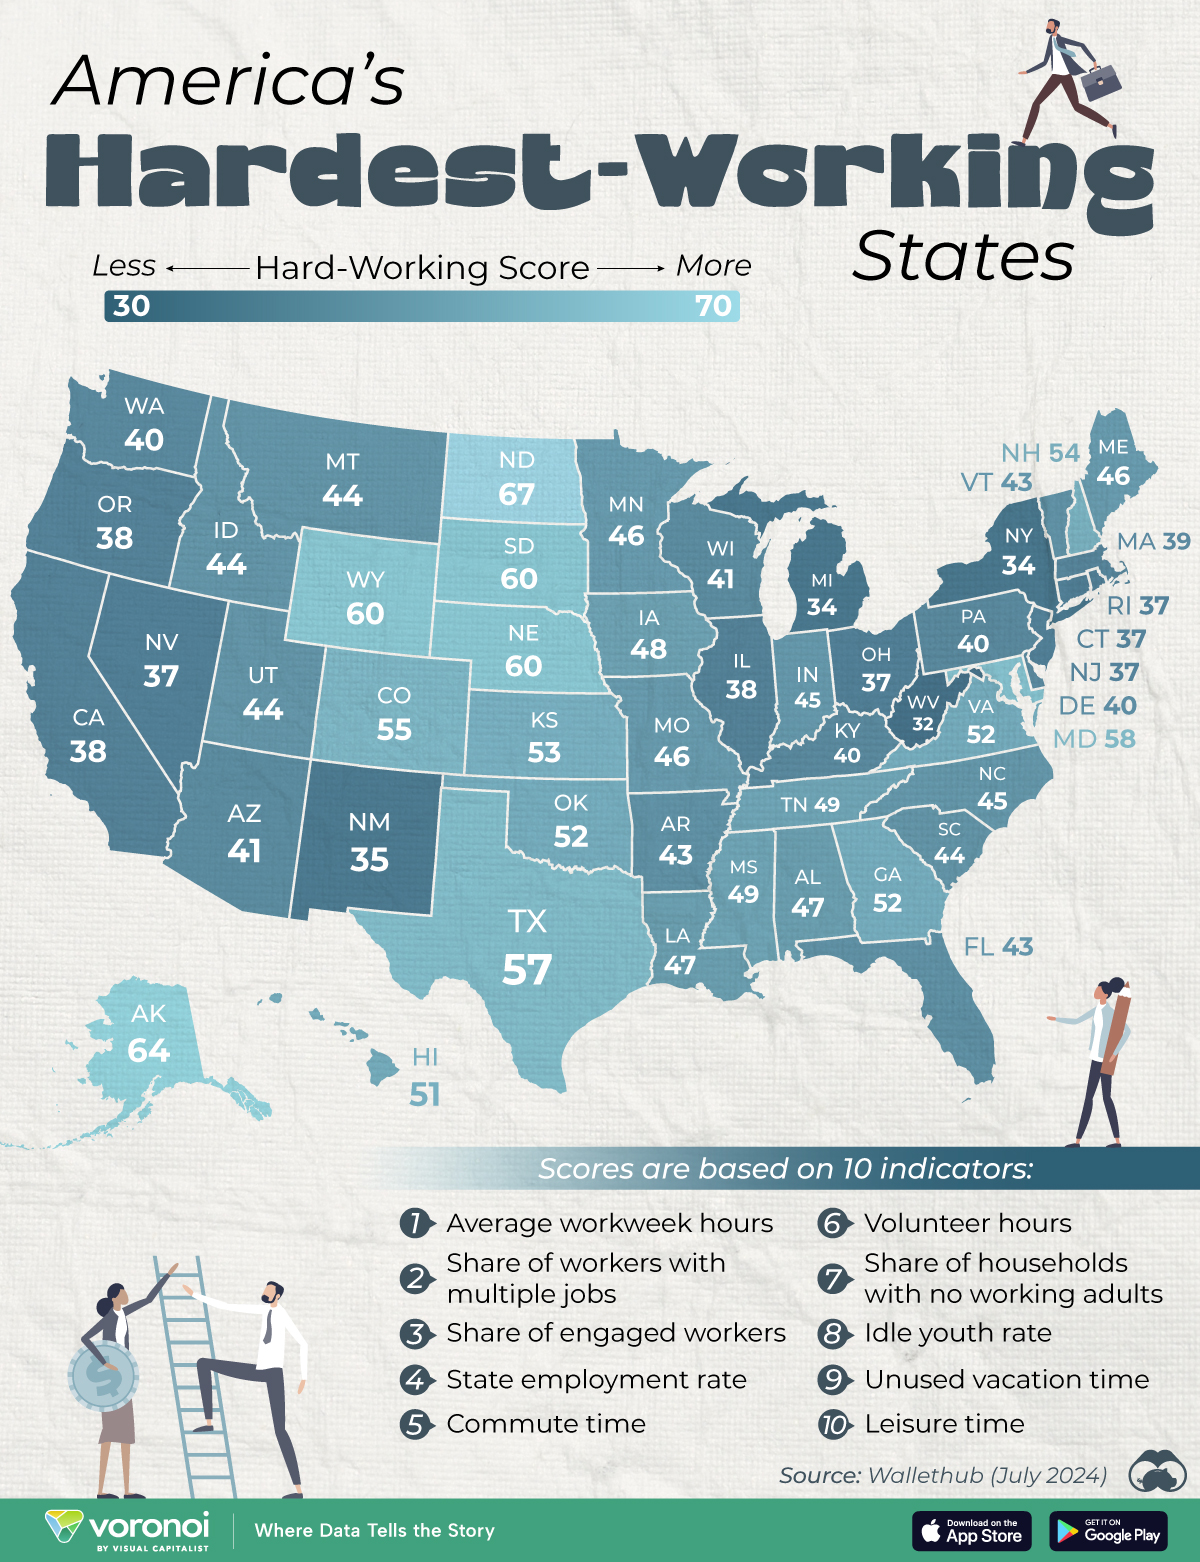
Mapped: The U.S. States That Work the Hardest
This was originally posted on our Voronoi app. Download the app for free on iOS or Android and discover incredible data-driven charts from a variety of trusted sources.
This map shows the U.S. states that work the hardest, as scored out of 100 by a Wallethub study conducted in July 2024.
Naturally trying to measure and compare “hard-work” requires a little bit of data analysis.
How Is Hard Work Quantified?
Here’s what Wallethub did. First they analyzed all states on 10 indicators and assigned them different weights.
These indicators are then divided into two categories. The main one, “Direct Work” contributes 80 points to the total score.
| Direct Work Factors | Weight | Points | Wallethub Definitions |
|---|---|---|---|
| Average Workweek Hours |
Triple Weight | 36.9 | N/A |
| Employment Rate | Full Weight | 12.3 | Employed 16+ civilian population / Total 16+ civilian population in labor force. |
| Share of Households Where No Adults Work |
Full Weight | 12.3 | N/A |
| Share of Workers Leaving Vacation Time Unused |
Half Weight | 6.2 | N/A |
| Share of Engaged Workers |
Half Weight | 6.2 | Share of employees who are “involved in, enthusiastic about and committed to their work and workplace.” |
| Idle-Youth | Half Weight | 6.2 | Rate of 18-24 residents not in school, or working and no degree beyond a high school diploma. |
Meanwhile, “Indirect Work” indicators help the state achieve the last 20 points.
| Indirect Work Factors | Weight | Points | Wallethub Definitions |
|---|---|---|---|
| Average Commute Time | Full Weight | 5.0 | N/A |
| Share of Workers with Multiple Jobs |
Full Weight | 5.0 | Employed population with multiple jobs / Total employed population. |
| Annual Volunteer Hours per Resident |
Full Weight | 5.0 | N/A |
| Average Leisure Time Spent per Day |
Full Weight | 5.0 | N/A |
Clearly, states that score better on higher-weighted indicators end up with a higher overall score, as seen below.
Ranked: America’s Hardest-Working States
Wallethub states North Dakota is the hardest-working American state, giving it a rounded score of 67/100. The state’s 98% employment rate helped in securing first place.
| Overall Rank | State | State Code | Total Score |
|---|---|---|---|
| 1 | North Dakota | ND | 67 |
| 2 | Alaska | AK | 64 |
| 3 | Nebraska | NE | 60 |
| 4 | Wyoming | WY | 60 |
| 5 | South Dakota | SD | 60 |
| 6 | Maryland | MD | 58 |
| 7 | Texas | TX | 57 |
| 8 | Colorado | CO | 55 |
| 9 | New Hampshire | NH | 54 |
| 10 | Kansas | KS | 53 |
| 11 | Virginia | VA | 52 |
| 12 | Oklahoma | OK | 52 |
| 13 | Georgia | GA | 52 |
| 14 | Hawaii | HI | 51 |
| 15 | Tennessee | TN | 49 |
| 16 | Mississippi | MS | 49 |
| 17 | Iowa | IA | 48 |
| 18 | Alabama | AL | 47 |
| 19 | Louisiana | LA | 47 |
| 20 | Missouri | MO | 46 |
| 21 | Minnesota | MN | 46 |
| 22 | Maine | ME | 46 |
| 23 | North Carolina | NC | 45 |
| 24 | Indiana | IN | 45 |
| 25 | Montana | MT | 44 |
| 26 | South Carolina | SC | 44 |
| 27 | Idaho | ID | 44 |
| 28 | Utah | UT | 44 |
| 29 | Arkansas | AR | 43 |
| 30 | Florida | FL | 43 |
| 31 | Vermont | VT | 43 |
| 32 | Arizona | AZ | 41 |
| 33 | Wisconsin | WI | 41 |
| 34 | Pennsylvania | PA | 40 |
| 35 | Washington | WA | 40 |
| 36 | Delaware | DE | 40 |
| 37 | Kentucky | KY | 40 |
| 38 | Massachusetts | MA | 39 |
| 39 | California | CA | 38 |
| 40 | Illinois | IL | 38 |
| 41 | Oregon | OR | 38 |
| 42 | Ohio | OH | 37 |
| 43 | New Jersey | NJ | 37 |
| 44 | Rhode Island | RI | 37 |
| 45 | Nevada | NV | 37 |
| 46 | Connecticut | CT | 37 |
| 47 | New Mexico | NM | 35 |
| 48 | Michigan | MI | 34 |
| 49 | New York | NY | 34 |
| 50 | West Virginia | WV | 32 |
Note: Figures rounded.
Meanwhile, Alaska ranks second with 64 points, due to its average workweek crossing 41 hours. It’s the only state in the study which crossed the standard 40-hour metric.
And Nebraska comes in third with 60 points. Wallethub states that more than 7% of its workforce has multiple jobs, the third-highest of all states.
A quick overview of the map reveals that the strip of states in the center of the country are the hardest-working, with scores falling as one moves east and west respectively. Interestingly this is also America’s farming country, a demanding sector that requires long hours.
Another interesting phenomenon is how Alaska and North Dakota have high direct work ranks but are bottom of the pack for indirect work.
| Overall Rank | State | Direct Work Factors Rank |
Indirect Work Factors Rank |
|---|---|---|---|
| 1 | North Dakota | 1 | 41 |
| 2 | Alaska | 2 | 34 |
| 3 | Nebraska | 5 | 5 |
| 4 | Wyoming | 6 | 2 |
| 5 | South Dakota | 3 | 26 |
| 6 | Maryland | 7 | 4 |
| 7 | Texas | 4 | 31 |
| 8 | Colorado | 9 | 7 |
| 9 | New Hampshire | 12 | 9 |
| 10 | Kansas | 10 | 25 |
| 11 | Virginia | 16 | 12 |
| 12 | Oklahoma | 8 | 44 |
| 13 | Georgia | 11 | 32 |
| 14 | Hawaii | 14 | 29 |
| 15 | Tennessee | 15 | 36 |
| 16 | Mississippi | 13 | 46 |
| 17 | Iowa | 18 | 24 |
| 18 | Alabama | 17 | 48 |
| 19 | Louisiana | 19 | 38 |
| 20 | Missouri | 24 | 20 |
| 21 | Minnesota | 26 | 8 |
| 22 | Maine | 33 | 1 |
| 23 | North Carolina | 23 | 30 |
| 24 | Indiana | 25 | 28 |
| 25 | Montana | 27 | 22 |
| 26 | South Carolina | 21 | 42 |
| 27 | Idaho | 30 | 6 |
| 28 | Utah | 35 | 3 |
| 29 | Arkansas | 20 | 50 |
| 30 | Florida | 22 | 47 |
| 31 | Vermont | 31 | 14 |
| 32 | Arizona | 28 | 39 |
| 33 | Wisconsin | 29 | 40 |
| 34 | Pennsylvania | 36 | 16 |
| 35 | Washington | 39 | 13 |
| 36 | Delaware | 32 | 37 |
| 37 | Kentucky | 34 | 35 |
| 38 | Massachusetts | 40 | 15 |
| 39 | California | 37 | 27 |
| 40 | Illinois | 42 | 19 |
| 41 | Oregon | 46 | 10 |
| 42 | Ohio | 43 | 21 |
| 43 | New Jersey | 45 | 17 |
| 44 | Rhode Island | 44 | 23 |
| 45 | Nevada | 38 | 43 |
| 46 | Connecticut | 49 | 11 |
| 47 | New Mexico | 41 | 45 |
| 48 | Michigan | 48 | 33 |
| 49 | New York | 50 | 18 |
| 50 | West Virginia | 47 | 49 |
However, Nebraska performs equally well in both categories. The Cornhusker state has a low share of idle-youth, and has the fifth-highest volunteer hours per capita in the country.
Learn More on the Voronoi App ![]()
Interestingly, many of America’s hardest-working states have much lower cost of living requirements. See how the data shakes out in The Income an Individual Needs to Live Comfortably in the States.
The post Mapped: U.S. States That Work the Hardest appeared first on Visual Capitalist.