![]()
See this visualization first on the Voronoi app.
Use This Visualization
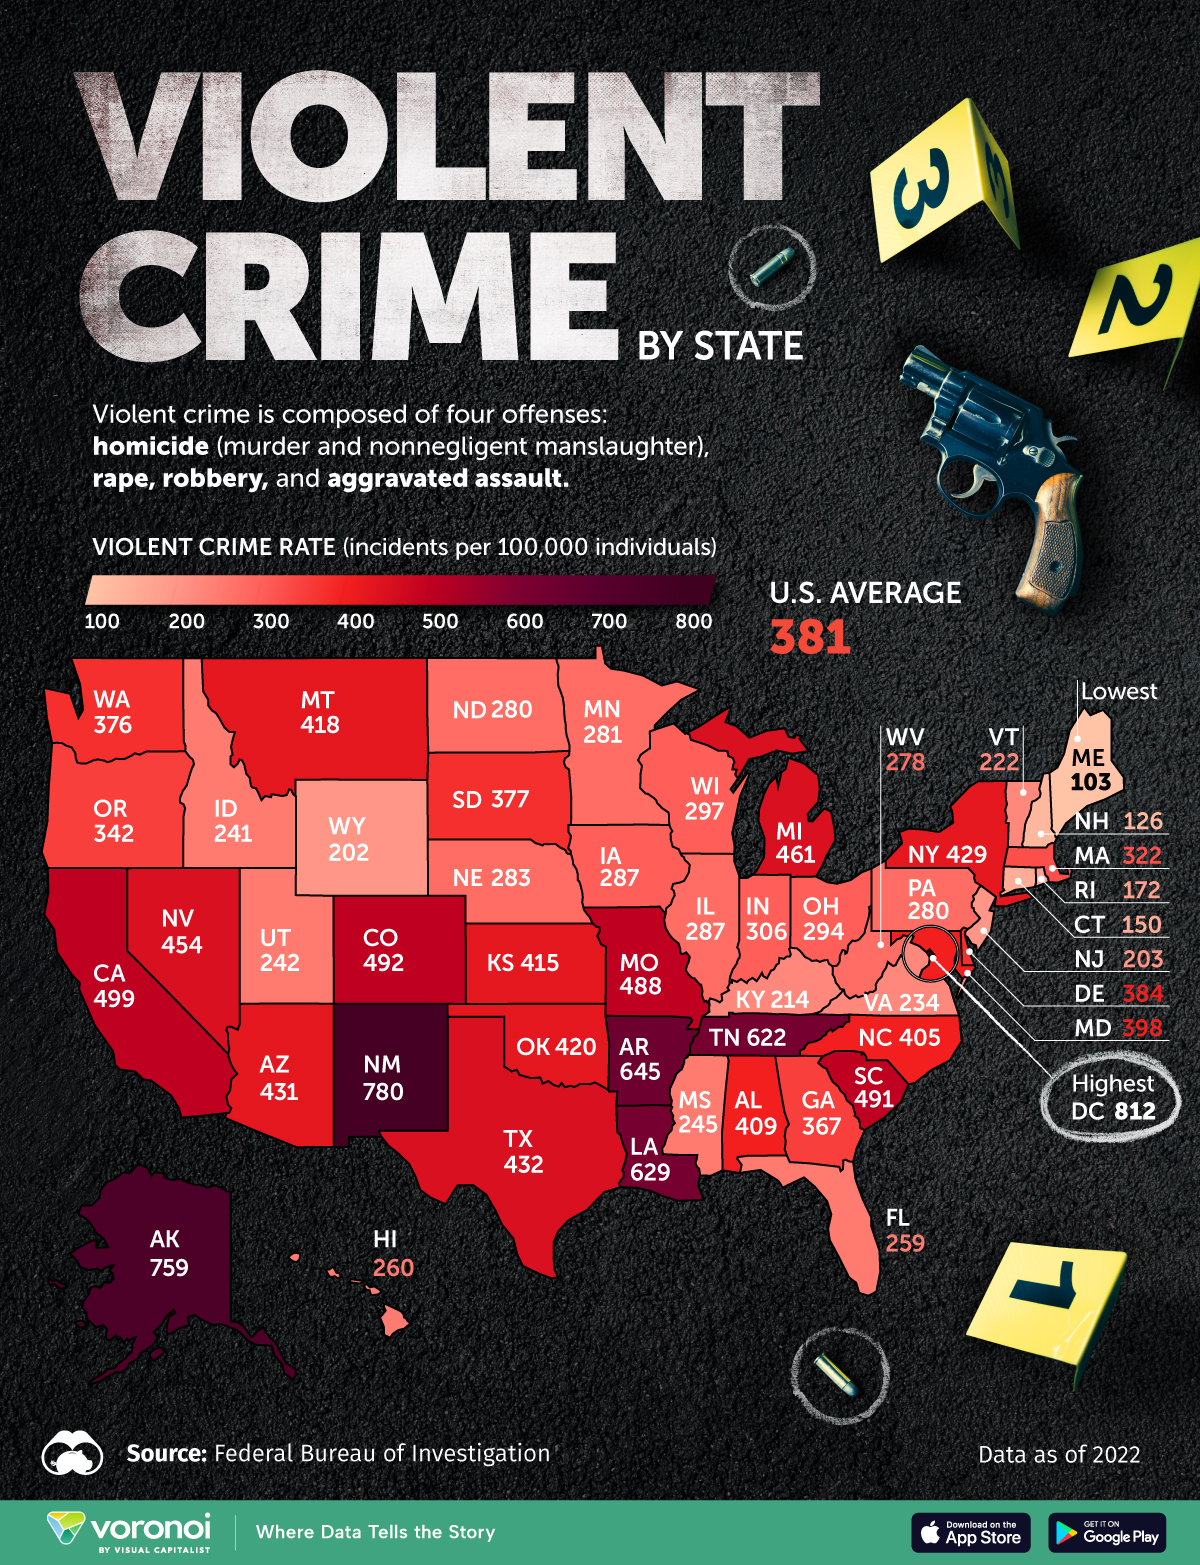
Violent Crime Rates by U.S. State
This was originally posted on our Voronoi app. Download the app for free on iOS or Android and discover incredible data-driven charts from a variety of trusted sources.
In 2022, there were about 1.2 million violent crimes reported to the Federal Bureau of Investigation (FBI).
Violent crimes comprise of four offenses: homicide (murder and nonnegligent manslaughter), rape, robbery, and aggravated assault.
The national violent crime rate has seen a gradual decrease over the last couple of years. In 2020, it sat at 398 incidents per 100,000 people, and as of 2022 the nationwide number sits at 381 incidents per 100,000 people.
This map visualizes the rate of violent crime per 100,000 individuals by U.S. state in 2022, with the figures from the FBI. The data is current as of October 2023.
The FBI national crime statistics for 2022 are based on data received from 16,100 of 18,930 participating law enforcement agencies in the country that year.
Nation’s Capital Leads in Violent Crime
DC recorded the highest violent crime rate in 2022, at 812 incidents per 100,000 residents. The district also saw the highest homicide rate in the country, at 29 homicides per 100,000.
| State | Violent crime rate (incidents per 100,000 individuals) |
|---|---|
| District of Columbia | 812 |
| New Mexico | 780 |
| Alaska | 759 |
| Arkansas | 645 |
| Louisiana | 629 |
| Tennessee | 622 |
| California | 499 |
| Colorado | 492 |
| South Carolina | 491 |
| Missouri | 488 |
| Michigan | 461 |
| Nevada | 454 |
| Texas | 432 |
| Arizona | 431 |
| New York | 429 |
| Oklahoma | 420 |
| Montana | 418 |
| Kansas | 415 |
| Alabama | 409 |
| North Carolina | 405 |
| Maryland | 398 |
| Delaware | 384 |
| South Dakota | 377 |
| Washington | 376 |
| Georgia | 367 |
| Oregon | 342 |
| Massachusetts | 322 |
| Indiana | 306 |
| Wisconsin | 297 |
| Ohio | 294 |
| Illinois | 287 |
| Iowa | 287 |
| Nebraska | 283 |
| Minnesota | 281 |
| Pennsylvania | 280 |
| North Dakota | 280 |
| West Virginia | 278 |
| Hawaii | 260 |
| Florida | 259 |
| Mississippi | 245 |
| Utah | 242 |
| Idaho | 241 |
| Virginia | 234 |
| Vermont | 222 |
| Kentucky | 214 |
| New Jersey | 203 |
| Wyoming | 202 |
| Rhode Island | 172 |
| Connecticut | 150 |
| New Hampshire | 126 |
| Maine | 103 |
This trend is continuing to rise in DC, with a 39% increase in violent crime reported in 2023.
Armed carjackings, particularly involving youth, have become a significant issue in recent years, with cases doubling from 2022 to 2023.
Some experts attribute the rise in violent crime to DC’s lack of statehood and its complex network of overlapping law enforcement agencies, such as the Metropolitan Police Department, FBI, U.S. Park Police, and Capitol Police, which makes coordination and communication challenging.
In second-ranked New Mexico, violent crime has seen a steady rise in the past 10 years, with around 11,660 incidents in 2012 to 16,494 in 2022.
According to data from the Centers for Disease Control and Prevention (CDC), from 2011 to 2022, there was an 84% increase in the firearm-related death rate in the state.
Learn More on the Voronoi App ![]()
To see how the U.S. homicide rate compares with that of Europe and the UK over time, check out this graphic.
The post Mapped: Violent Crime Rates by U.S. State appeared first on Visual Capitalist.