![]()
See more visuals like this on the Voronoi app.
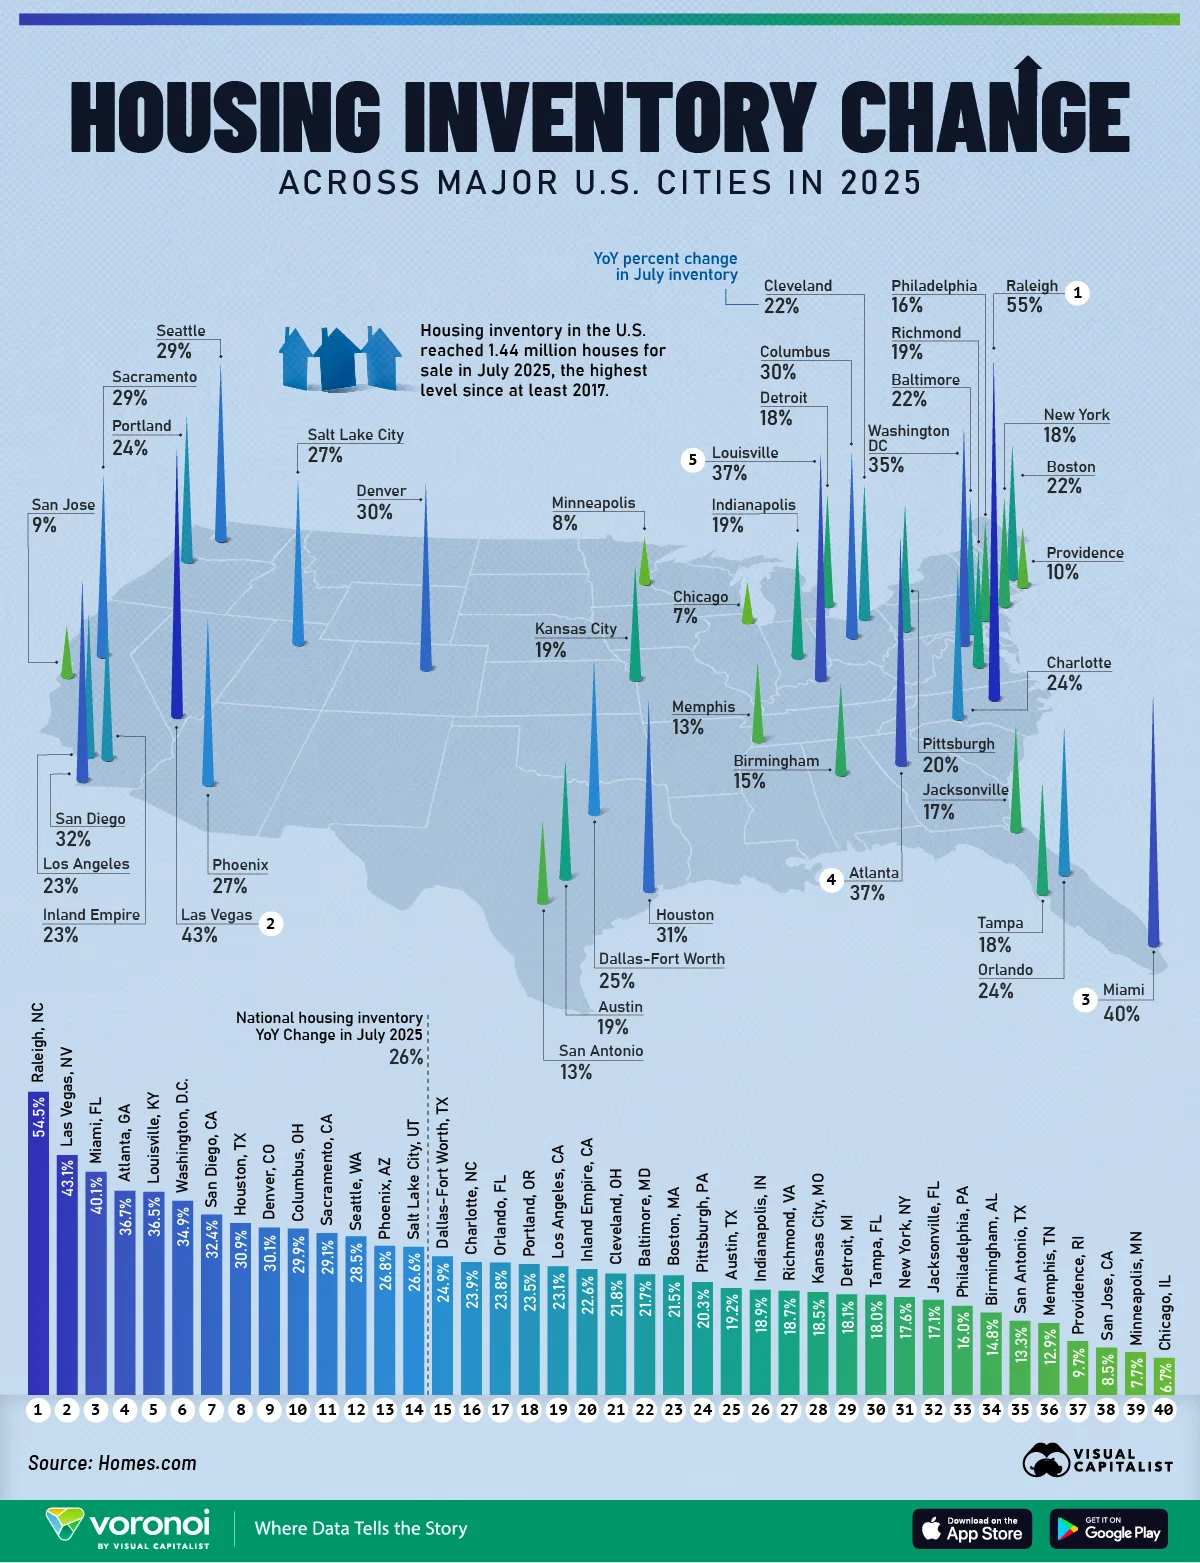
Where Housing Inventory is Rising in U.S. Cities
See visuals like this from many other data creators on our Voronoi app. Download it for free on iOS or Android and discover incredible data-driven charts from a variety of trusted sources.
Key Takeaways
- U.S. housing inventory rose 26% year-over-year in July 2025, reaching its highest level since at least 2017.
- Sun Belt and fast-growing metro areas saw the sharpest increases in homes for sale.
After years of historically tight housing supply, inventory levels across the U.S. are rebounding. More homes are coming onto the market, giving buyers greater choice and easing some of the pressure that defined the post-pandemic housing boom. This map highlights how housing inventory changed across major U.S. cities in July 2025 compared to a year earlier.
The data for this visualization comes from Homes.com.
Sun Belt Cities Lead the Inventory Surge
Several fast-growing Sun Belt metros top the list for inventory growth. Raleigh, North Carolina, saw the largest increase, with listings up 54.5% year over year.
| Rank | City | YoY % change in July |
|---|---|---|
| 1 | Raleigh, NC | 54.5% |
| 2 | Las Vegas, NV | 43.1% |
| 3 | Miami, FL | 40.1% |
| 4 | Atlanta, GA | 36.7% |
| 5 | Louisville, KY | 36.5% |
| 6 | Washington, D.C. | 34.9% |
| 7 | San Diego, CA | 32.4% |
| 8 | Houston, TX | 30.9% |
| 9 | Denver, CO | 30.1% |
| 10 | Columbus, OH | 29.9% |
| 11 | Sacramento, CA | 29.1% |
| 12 | Seattle, WA | 28.5% |
| 13 | Phoenix, AZ | 26.8% |
| 14 | Salt Lake City, UT | 26.6% |
| 15 | Dallas-Fort Worth, TX | 24.9% |
| 16 | Charlotte, NC | 23.9% |
| 17 | Orlando, FL | 23.8% |
| 18 | Portland, OR | 23.5% |
| 19 | Los Angeles, CA | 23.1% |
| 20 | Inland Empire, CA | 22.6% |
| 21 | Cleveland, OH | 21.8% |
| 22 | Baltimore, MD | 21.7% |
| 23 | Boston, MA | 21.5% |
| 24 | Pittsburgh, PA | 20.3% |
| 25 | Austin, TX | 19.2% |
| 26 | Indianapolis, IN | 18.9% |
| 27 | Richmond, VA | 18.7% |
| 28 | Kansas City, MO | 18.5% |
| 29 | Detroit, MI | 18.1% |
| 30 | Tampa, FL | 18.0% |
| 31 | New York, NY | 17.6% |
| 32 | Jacksonville, FL | 17.1% |
| 33 | Philadelphia, PA | 16.0% |
| 34 | Birmingham, AL | 14.8% |
| 35 | San Antonio, TX | 13.3% |
| 36 | Memphis, TN | 12.9% |
| 37 | Providence, RI | 9.7% |
| 38 | San Jose, CA | 8.5% |
| 39 | Minneapolis, MN | 7.7% |
| 40 | Chicago, IL | 6.7% |
Las Vegas, Miami, and Atlanta also posted gains above 35%, reflecting a rapid cooling from earlier housing booms.
Large Coastal Markets See Meaningful Gains
Major coastal cities are also seeing notable increases in housing inventory. San Diego’s listings rose 32.4%, while Los Angeles posted a 23.1% increase. Seattle, Sacramento, and Portland all saw gains near or above the national average.
Although inventory is rising, affordability challenges remain acute in these markets. Higher mortgage rates and elevated home prices continue to limit buyer activity.
In contrast, several Midwestern and Northeastern cities recorded more modest inventory growth. Chicago’s listings increased just 6.7%, while Minneapolis and San Jose saw gains below 10%. New York City’s inventory rose 17.6%, well below the national average.
Learn More on the Voronoi App ![]()
If you enjoyed today’s post, check out America’s 1.1 Million Job Cuts by State in 2025 on Voronoi, the new app from Visual Capitalist.