![]()
See this visualization first on the Voronoi app.
Use This Visualization
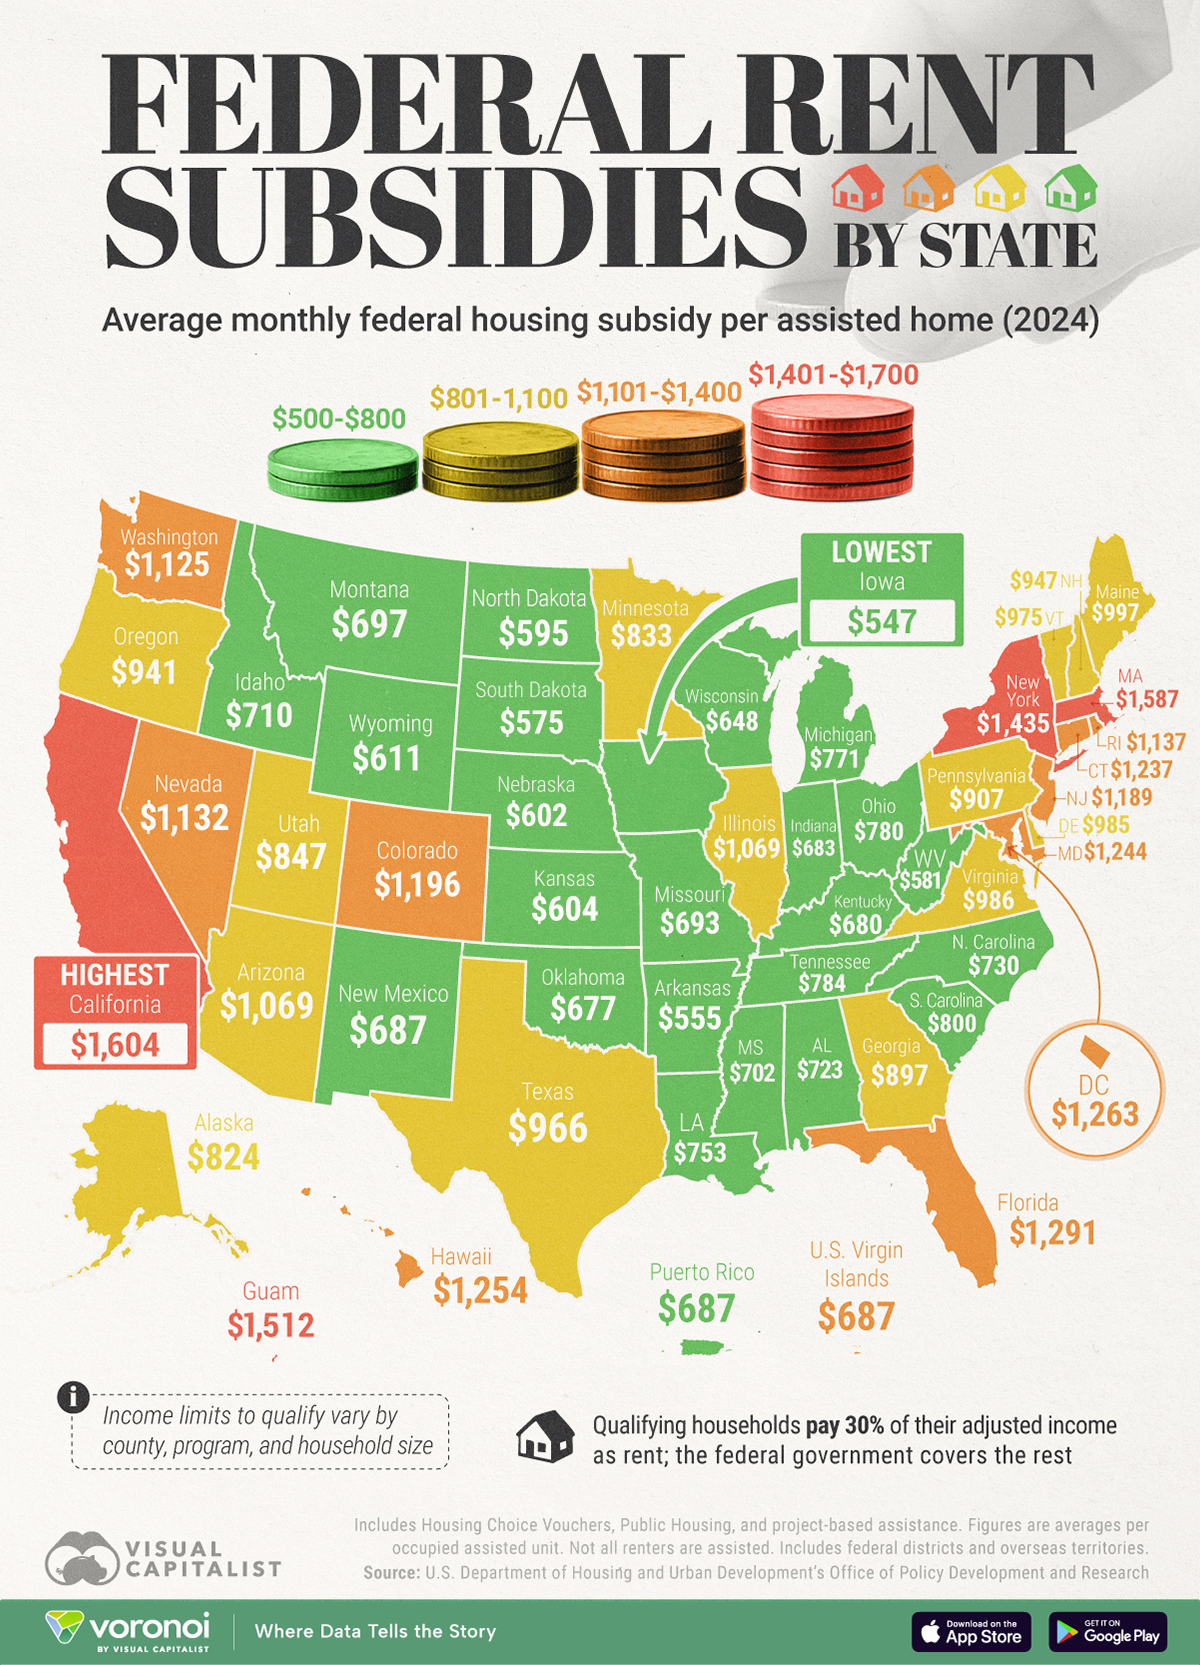
Mapped: Where Rent Subsidies Are Highest, by U.S. State
This was originally posted on our Voronoi app. Download the app for free on iOS or Android and discover incredible data-driven charts from a variety of trusted sources.
Key Takeaways
- On average, low-income California renters received $1,604 a month from the federal government for rent in 2024, the highest in the country.
- Low-income Iowa renters received $547, the lowest level of support per state.
About one-third of America’s 342 million people are renters.
And for many of the low-income households, keeping a roof overhead hinges on federal help.
The above map colors every U.S. state by the average monthly federal rent subsidy received per household receiving assistance in 2024, showing just how widely support can vary for families with similar needs.
Data for this visualization comes from the U.S. Department of Housing and Urban Development’s Office of Policy Development and Research (also known as the HUD).
It tracks average HUD expenditures under major rental-assistance programs, including Housing Choice Vouchers, Public Housing, and project-based assistance.
Qualifying households pay 30% of their adjusted income as rent; the federal government covers the rest. Income limits to qualify for rental support vary by county, program, and household size.
Ranked: Where Rent Subsidies Are Highest, by U.S. State
On average, low-income California renters received $1,604 a month from the federal government for rent in 2024, the highest in the country.
They beat the national average ($1,067) by more than $500.
| Rank | State / Territory | Average Rental Assistance / Month |
Average Family Expenditure / Month |
Annual Household Income |
|---|---|---|---|---|
| 1 | California | $1,604 | $559 | $21,832 |
| 2 | Massachusetts | $1,587 | $541 | $22,613 |
| 3 | Guam | $1,512 | $451 | $19,497 |
| 4 | New York | $1,435 | $545 | $22,339 |
| 5 | U.S. Virgin Islands | $1,298 | $387 | $17,395 |
| 6 | Florida | $1,291 | $457 | $17,969 |
| 7 | District of Columbia | $1,263 | $363 | $18,880 |
| 8 | Hawaii | $1,254 | $572 | $22,820 |
| 9 | Maryland | $1,244 | $470 | $19,470 |
| 10 | Connecticut | $1,237 | $512 | $20,429 |
| 11 | Colorado | $1,196 | $417 | $16,964 |
| 12 | New Jersey | $1,189 | $493 | $20,859 |
| 13 | Northern Mariana Islands | $1,161 | $224 | $9,661 |
| 14 | Rhode Island | $1,137 | $477 | $19,930 |
| 15 | Nevada | $1,132 | $421 | $16,827 |
| 16 | Washington | $1,125 | $445 | $18,508 |
| 17 | Arizona | $1,069 | $405 | $16,415 |
| 18 | Illinois | $1,069 | $394 | $16,393 |
| 19 | Maine | $997 | $447 | $18,486 |
| 20 | Virginia | $986 | $426 | $17,677 |
| 21 | Delaware | $985 | $444 | $18,677 |
| 22 | Vermont | $975 | $455 | $18,976 |
| 23 | Texas | $966 | $395 | $16,166 |
| 24 | New Hampshire | $947 | $493 | $21,120 |
| 25 | Oregon | $941 | $405 | $15,992 |
| 26 | Pennsylvania | $907 | $411 | $17,389 |
| 27 | Georgia | $897 | $384 | $16,422 |
| 28 | Utah | $847 | $405 | $16,344 |
| 29 | Minnesota | $833 | $434 | $18,341 |
| 30 | Alaska | $824 | $589 | $23,164 |
| 31 | South Carolina | $800 | $358 | $15,174 |
| 32 | Tennessee | $784 | $346 | $14,767 |
| 33 | Ohio | $780 | $331 | $13,528 |
| 34 | Michigan | $771 | $373 | $15,457 |
| 35 | Louisiana | $753 | $367 | $15,113 |
| 36 | Puerto Rico | $737 | $157 | $7,060 |
| 37 | North Carolina | $730 | $366 | $15,370 |
| 38 | Alabama | $723 | $352 | $15,538 |
| 39 | Idaho | $710 | $418 | $17,061 |
| 40 | Mississippi | $702 | $335 | $14,290 |
| 41 | Montana | $697 | $381 | $16,307 |
| 42 | Missouri | $693 | $354 | $15,235 |
| 43 | New Mexico | $687 | $357 | $14,959 |
| 44 | Indiana | $683 | $346 | $14,492 |
| 45 | Kentucky | $680 | $335 | $14,462 |
| 46 | Oklahoma | $677 | $320 | $13,616 |
| 47 | Wisconsin | $648 | $400 | $17,048 |
| 48 | Wyoming | $611 | $394 | $16,911 |
| 49 | Kansas | $604 | $361 | $16,041 |
| 50 | Nebraska | $602 | $408 | $17,901 |
| 51 | North Dakota | $595 | $372 | $16,128 |
| 52 | West Virginia | $581 | $334 | $14,006 |
| 53 | South Dakota | $575 | $362 | $15,850 |
| 54 | Arkansas | $555 | $332 | $14,595 |
| 55 | Iowa | $547 | $370 | $15,613 |
Sky-high market rents, especially in coastal metros, push federal vouchers higher to keep them competitive in tight housing markets.
Fact: There are four California cities in the top 10 most expensive U.S. cities to rent in.
Even with this support, participating families still spent roughly $559 of their own income on rent each month, underscoring the expensiveness of the Golden State.
U.S. Rental Support Trends Follow Rental Markets
Unsurprisingly, the states with the most expensive housing markets, like Massachusetts ($1,587) and New York ($1,435) are also present in the top five for rental assistance.
However, the presence of Guam ($1,512), and the U.S. Virgin Islands ($1,298) is interesting, because another overseas territory, Puerto Rico ($737), is further down the list.
For Guam, a steady demand for housing comes from an influx of residents due to the island’s military base.
Related: See every known U.S. overseas military base located on this map.
The small land area and growing population put upward pressure on prices. Development opportunities are limited and infrastructure expansions (utilities, roads) are costly.
As of 2025, the average price of a single-family home in Guam is about $508,000, more than double a decade ago.
For the U.S. Virgin Islands, significant non-resident demand for seasonal and second homes skews sales toward higher price points.
These expensive housing markets have an effect on the rental market in two ways.
When home values surge, landlords face larger mortgage payments and higher property taxes, resulting in upward pressure on rents.
Then, when buying a home becomes unattainable for many, demand for rental properties climbs further driving up rental prices.
The Midwest and South See the Smallest Rental Assistance Checks
At the other end of the spectrum, nine of the 10 lowest-subsidy states are in the Midwest or South.
Iowa’s average allotment of $547 in 2024 was nearly half the national average, while Arkansas, South Dakota, and West Virginia all fell below $600.
Lower market rents partly explain the gap, but incomes are lower in these states as well.
What Drives the Gap in Rental Assistance?
HUD’s formula ties voucher size to local “fair-market rent,” so jurisdictions with pricey housing automatically receive larger checks.
Yet higher subsidies don’t always guarantee availability: California and New York still face long waitlists.
Meanwhile, smaller checks in the Midwest may mask hidden affordability strains, as aging housing stock and stagnant wages squeeze tenants.
Together, the data highlights a core policy challenge: balancing equity across regions while responding to hyper-local housing dynamics.
Learn More on the Voronoi App ![]()
If you enjoyed today’s post, check out The Most Affordable ZIP Code for Renters by State on Voronoi, the new app from Visual Capitalist.