![]()
See this visualization first on the Voronoi app.
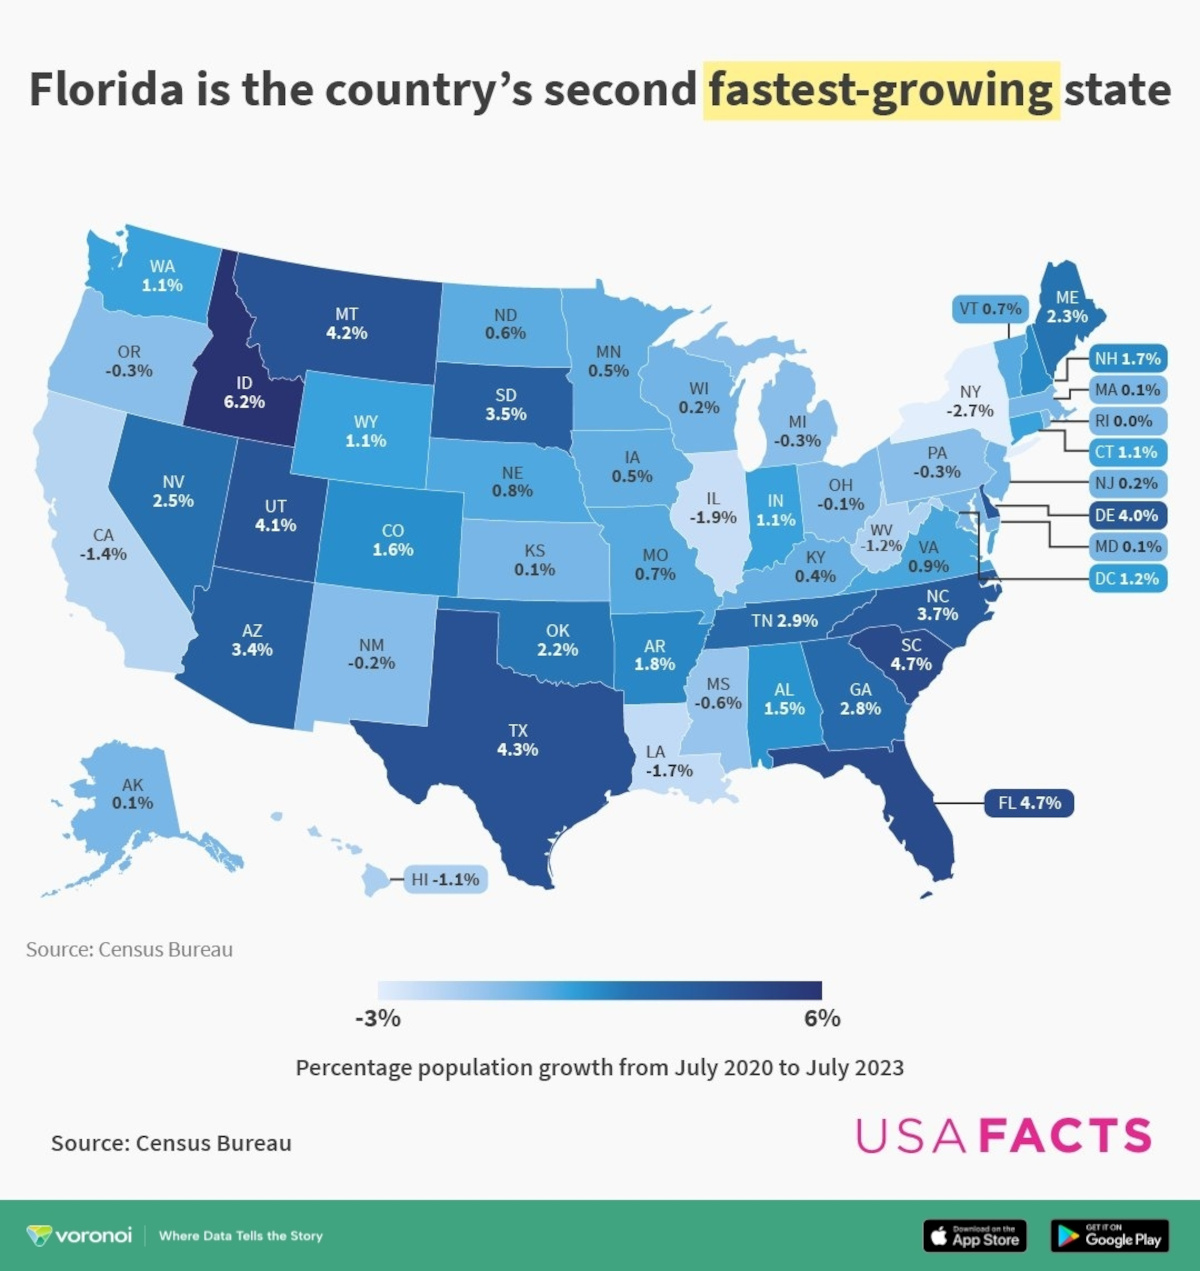
Mapped: Which State Population Has Changed the Most?
This was originally posted on our Voronoi app. Download the app for free on iOS or Android and discover incredible data-driven charts from a variety of trusted sources.
The current U.S. population is over 340 million, a 10 million jump from the 2020 Census. While the U.S. population has shown general growth over the past few decades, population distribution throughout the nation has changed dramatically in some places recently.
For this graphic, USAFacts has put together a map showing each U.S. state’s percentage population change between 2020 and 2023.
How Has Each State Changed?
State populations are bound to fluctuate. But in recent years, the population of some states, such as Idaho, has grown by as much as 6%.
Below is a list of each state and the percentage change in its population between 2020 and 2023.
| State | % Change (2020–2023) |
|---|---|
| Alabama | 1.5% |
| Alaska | 0.1% |
| Arizona | 1.8% |
| Arkansas | 1.8% |
| California | -1.4% |
| Colorado | 1.6% |
| Connecticut | 1.1% |
| Delaware | 4.0% |
| District of Columbia | 1.2% |
| Florida | 4.7% |
| Georgia | 2.8% |
| Hawaii | -1.1% |
| Idaho | 6.2% |
| Illinois | -1.9% |
| Indiana | 1.1% |
| Iowa | 0.5% |
| Kansas | 0.1% |
| Kentucky | 0.4% |
| Louisiana | -1.7% |
| Maine | 0.1% |
| Maryland | 0.1% |
| Massachusetts | 0.1% |
| Michigan | -0.3% |
| Minnesota | 0.5% |
| Mississippi | -0.6% |
| Missouri | 0.7% |
| Montana | 4.2% |
| Nebraska | 0.8% |
| Nevada | 2.5% |
| New Hampshire | 1.7% |
| New Jersey | 0.2% |
| New Mexico | -0.2% |
| New York | -2.7% |
| North Carolina | 3.7% |
| North Dakota | 0.6% |
| Ohio | -0.1% |
| Oklahoma | 2.2% |
| Oregon | -0.3% |
| Pennsylvania | -0.3% |
| Rhode Island | 0.0% |
| South Carolina | 4.7% |
| South Dakota | 3.5% |
| Tennessee | 2.9% |
| Texas | 4.3% |
| Utah | 4.1% |
| Vermont | 0.7% |
| Virginia | 0.9% |
| Washington | 1.1% |
| West Virginia | -1.2% |
| Wisconsin | 0.2% |
| Wyoming | 1.1% |
High Growth in Idaho and Florida
Many states saw their populations grow, some by as little as 0.1% in Massachusetts and Maryland, but many have grown much more.
Montana’s population grew by 4.2% between 2020 and 2023. There are many reasons why people might move to Montana, but the state’s beauty, lack of sales tax, and lower property taxes undoubtedly powered its growth.
Texas also saw a 4.3% growth, possibly due to the many job opportunities in energy, software, and technology available in the state. However, Florida and Idaho saw the most significant percentage growth: 4.7% and 6.2%, respectively.
The weather in Florida, lack of state income tax, and lower cost of living make it a tempting opportunity for many Americans, particularly retirees who make up 21% of the state’s population.
Idaho’s population grew for similar reasons, particularly job opportunities and a favorable tax environment.
Taxes and Jobs: The Reasons People Move
While America’s population has grown consistently over the past few decades, some states, like New York and Illinois, have seen their populations decrease. However, many states, such as Idaho and Florida, have grown in population, particularly with favorable tax conditions, job opportunities, and a lower cost of living.
Learn More on the Voronoi App ![]()
Which state has the highest tax rate? See this graphic on Voronoi to find out.
The post Mapped: Which State Population Has Changed the Most? appeared first on Visual Capitalist.