![]()
See this visualization first on the Voronoi app.

Use This Visualization
Mapped: U.S. States With the Most Imports from China
This was originally posted on our Voronoi app. Download the app for free on iOS or Android and discover incredible data-driven charts from a variety of trusted sources.
Key Takeaways
- In 2024, the U.S. imported $438.9 billion from China totaling 13.4% of all goods imports.
- Nevada had the highest reliance on Chinese imports, at 26% of the total share—led by electrical machinery and parts.
- With two of the nation’s largest ports, California imported $122.8 billion in goods, the most by far across states.
As trade wars intensify, some states are significantly more exposed to the impact of tariffs on China than others.
With $438.9 billion in Chinese goods entering the U.S. in 2024, the country played a key role in shipping computers, consumer electronics, and apparel to American consumers. Overall, China stands as the nation’s third-largest trade partner, covering 13.4% of all imports last year.
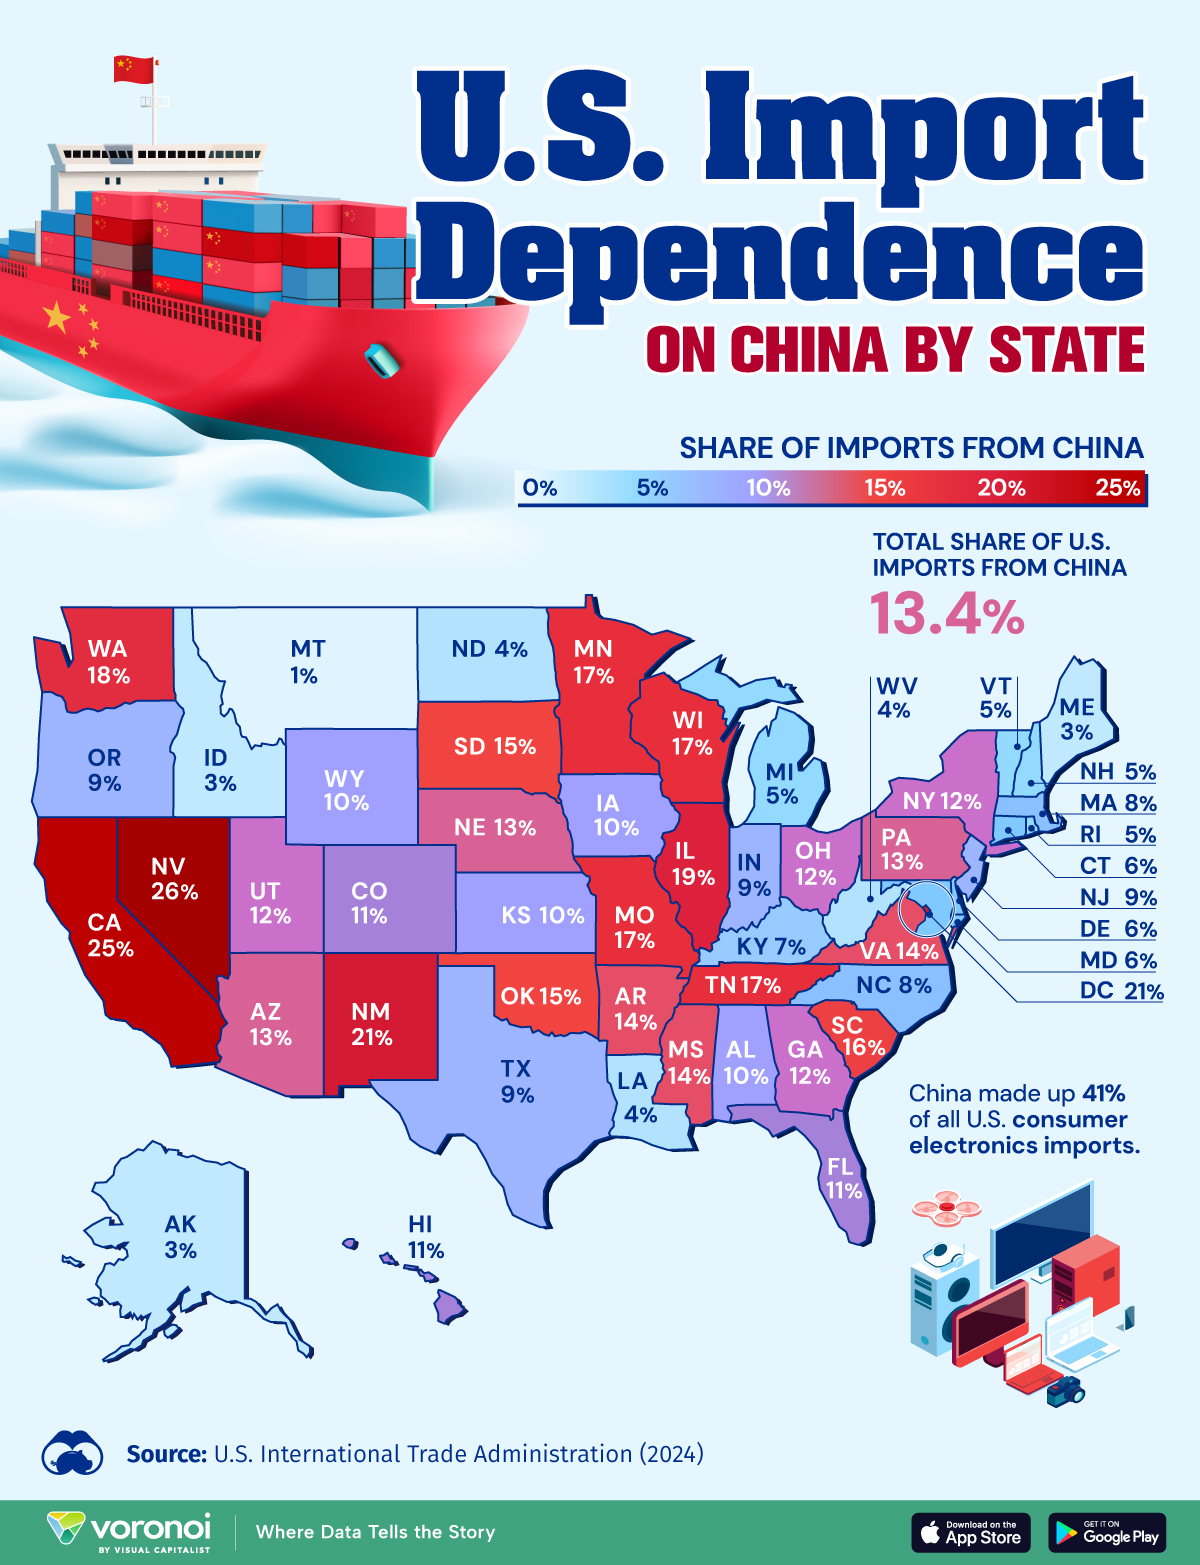
This graphic shows the U.S. states with the highest share of imports from China, based on data from the U.S. International Trade Association.
The U.S. States Most Dependent on Imports from China
Below, we rank U.S. states by their share of imports from China in 2024:
| State | Share of Imports from China 2024 |
|---|---|
| Nevada | 26% |
| California | 25% |
| Washington DC | 21% |
| New Mexico | 21% |
| Illinois | 19% |
| Washington | 18% |
| Missouri | 17% |
| Tennessee | 17% |
| Minnesota | 17% |
| Wisconsin | 17% |
| South Carolina | 16% |
| South Dakota | 15% |
| Oklahoma | 15% |
| Arkansas | 14% |
| Virginia | 14% |
| Mississippi | 14% |
| Pennsylvania | 13% |
| Arizona | 13% |
| Nebraska | 13% |
| Utah | 12% |
| Georgia | 12% |
| Ohio | 12% |
| New York | 12% |
| Hawaii | 11% |
| Florida | 11% |
| Colorado | 11% |
| Kansas | 10% |
| Iowa | 10% |
| Alabama | 10% |
| Wyoming | 10% |
| Oregon | 9% |
| New Jersey | 9% |
| Texas | 9% |
| Indiana | 9% |
| North Carolina | 8% |
| Massachusetts | 8% |
| Kentucky | 7% |
| Delaware | 6% |
| Maryland | 6% |
| Connecticut | 6% |
| Vermont | 5% |
| New Hampshire | 5% |
| Michigan | 5% |
| Rhode Island | 5% |
| West Virginia | 4% |
| Louisiana | 4% |
| North Dakota | 4% |
| Idaho | 3% |
| Maine | 3% |
| Alaska | 3% |
| Montana | 1% |
With 26% of goods imports from China, Nevada has the highest share overall.
As the state isn’t a major manufacturing hub, this could lead to higher prices for a wide range of consumer products. Additionally, businesses are bracing for higher potential costs. To prepare for these additional levies, some businesses have stockpiled supplies in advance as a buffer against price increases.
Ranking in second is California, with Chinese goods making up a quarter of imports. As the state’s largest import origin, China accounted for almost 30% of manufacturing imports.
By contrast, Montana is the least reliant on Chinese imports, with just 1% of goods imported from the country.
After Trump imposed additional 20% tariffs on China, in addition to the 10% already in place from his first term, China responded with up to 15% levies on U.S. agricultural products that came into effect on March 10. Yet new announcements on April 2 stand to impose a 34% blanket tariff looking ahead, with potentially negative economic impacts to both countries.
Learn More on the Voronoi App ![]()
See all the newly introduced global tariffs by President Trump on April 2nd, 2025 in this new graphic on Voronoi.
The post Mapped: Which U.S. States Import the Most from China? appeared first on Visual Capitalist.