![]()
See this visualization first on the Voronoi app.
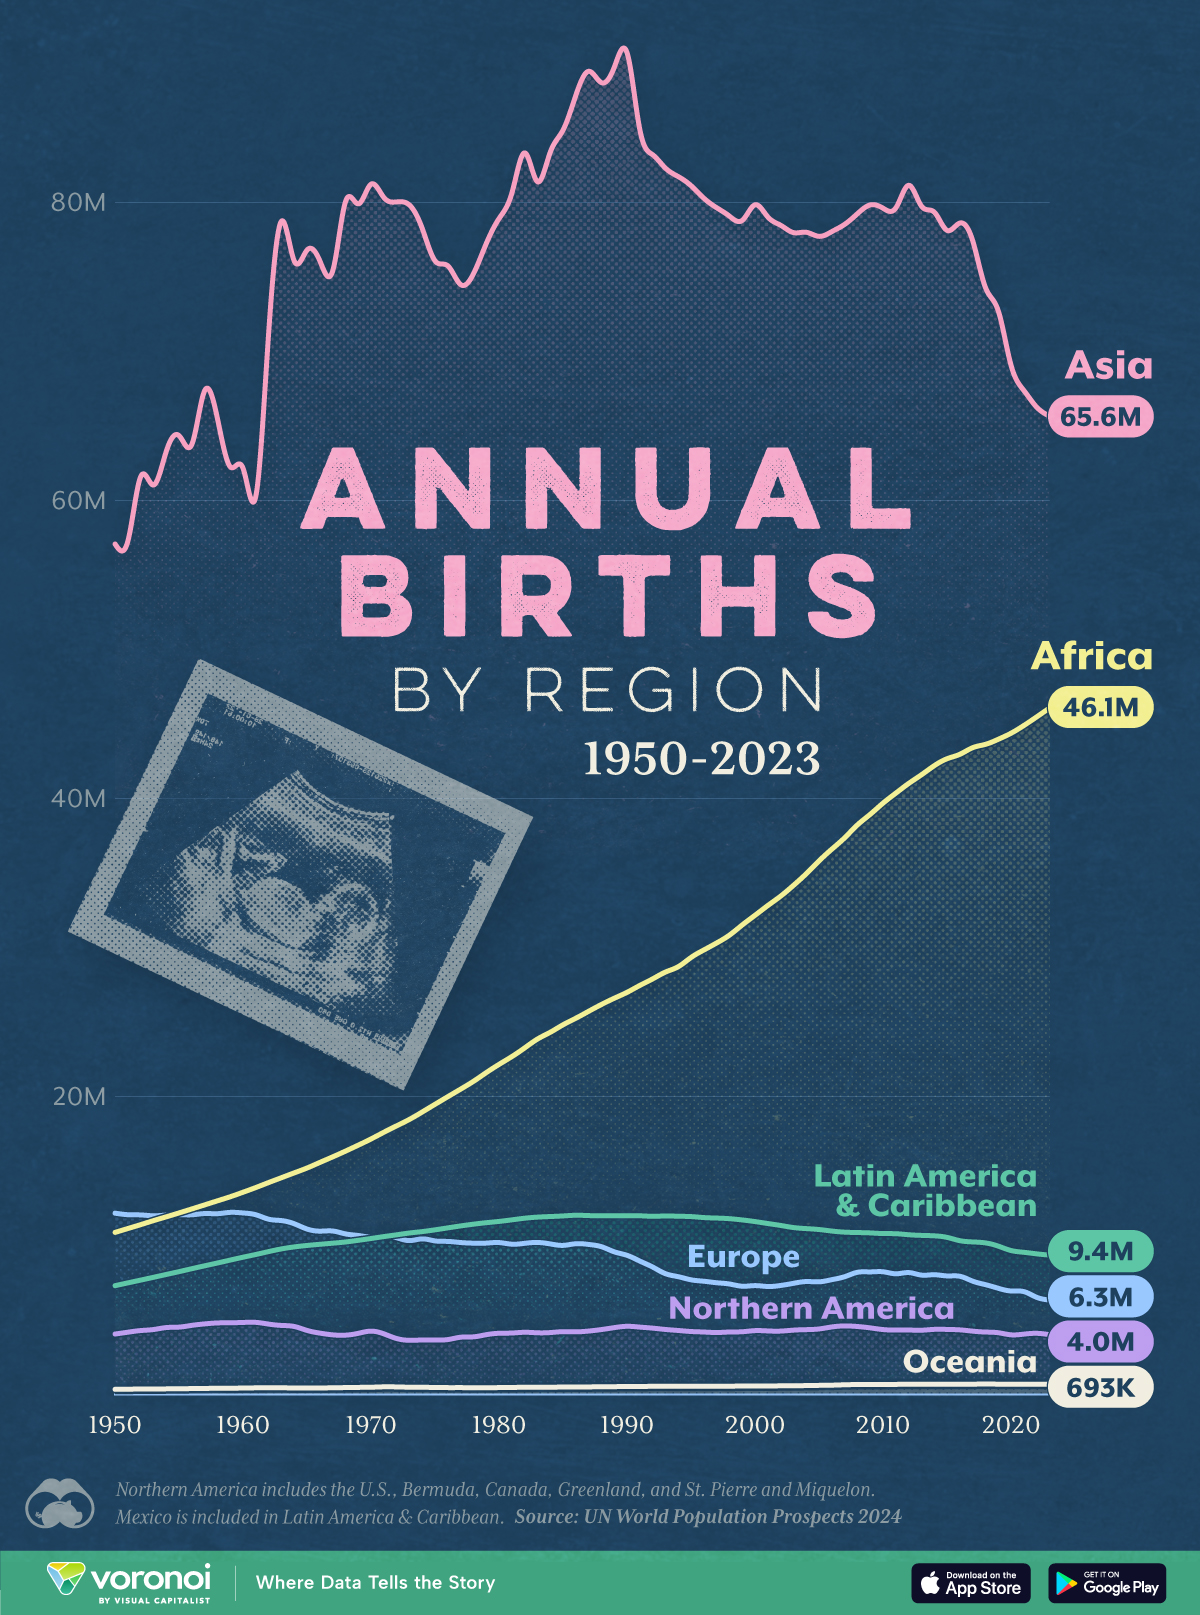
The Number of People Born Every Year, by Region (1950–2023)
This was originally posted on our Voronoi app. Download the app for free on iOS or Android and discover incredible data-driven charts from a variety of trusted sources.
It’s a commonly known fact that the world population has more than doubled since the 1970s, to 8 billion people in 2024. But where exactly has all that increase taken place? And what can examining these birth trends tell us about the future?
We visualize the number of births in each global region, from 1950 to 2023. All figures were sourced from the UN World Population Prospects 2024.
Importantly, the region Northern America includes the U.S., Bermuda, Canada, Greenland, and St. Pierre and Miquelon. Mexico, on the other hand, is included in Latin America & Caribbean.
Asia’s Population Boom Has Stopped, Africa’s Continues
For the last six decades, Asia has recorded more than 60 million births every year. In fact, Asia’s annual births peaked at 90 million in 1990, but there’s been a steep drop since 2012.
| Year | Africa | Asia | Oceania |
|---|---|---|---|
| 1950 | 10,878,550 | 57,064,430 | 348,990 |
| 1951 | 11,138,510 | 57,272,260 | 356,790 |
| 1952 | 11,398,580 | 61,583,050 | 370,330 |
| 1953 | 11,669,180 | 61,026,710 | 374,860 |
| 1954 | 11,924,010 | 63,291,210 | 379,230 |
| 1955 | 12,185,520 | 64,332,880 | 389,240 |
| 1956 | 12,452,580 | 63,763,680 | 398,290 |
| 1957 | 12,725,150 | 67,363,200 | 409,910 |
| 1958 | 12,997,770 | 65,466,370 | 416,880 |
| 1959 | 13,271,430 | 62,243,710 | 424,990 |
| 1960 | 13,574,660 | 62,137,840 | 433,360 |
| 1961 | 13,890,990 | 60,313,340 | 447,630 |
| 1962 | 14,224,920 | 71,286,750 | 446,790 |
| 1963 | 14,549,410 | 78,726,900 | 448,130 |
| 1964 | 14,873,520 | 76,051,990 | 441,590 |
| 1965 | 15,200,800 | 76,794,890 | 437,300 |
| 1966 | 15,573,970 | 76,055,130 | 441,440 |
| 1967 | 15,945,670 | 75,394,990 | 450,480 |
| 1968 | 16,330,530 | 80,032,750 | 466,350 |
| 1969 | 16,733,080 | 79,891,430 | 478,990 |
| 1970 | 17,149,970 | 81,210,590 | 488,870 |
| 1971 | 17,599,820 | 80,314,130 | 516,090 |
| 1972 | 18,030,480 | 80,022,130 | 509,670 |
| 1973 | 18,462,560 | 79,808,490 | 490,220 |
| 1974 | 18,959,740 | 78,226,180 | 485,220 |
| 1975 | 19,476,170 | 76,064,490 | 472,580 |
| 1976 | 19,987,210 | 75,728,600 | 462,960 |
| 1977 | 20,493,580 | 74,472,690 | 463,220 |
| 1978 | 21,016,840 | 75,209,190 | 459,540 |
| 1979 | 21,600,690 | 77,233,390 | 460,750 |
| 1980 | 22,153,360 | 78,908,620 | 463,960 |
| 1981 | 22,677,100 | 80,628,240 | 476,520 |
| 1982 | 23,258,570 | 83,312,660 | 483,750 |
| 1983 | 23,852,380 | 81,377,520 | 491,430 |
| 1984 | 24,307,370 | 83,360,760 | 491,440 |
| 1985 | 24,811,280 | 84,852,410 | 501,490 |
| 1986 | 25,251,250 | 87,191,670 | 504,940 |
| 1987 | 25,715,320 | 88,785,360 | 510,970 |
| 1988 | 26,172,010 | 88,023,380 | 519,090 |
| 1989 | 26,590,810 | 89,064,560 | 526,680 |
| 1990 | 26,988,120 | 90,014,730 | 543,510 |
| 1991 | 27,451,830 | 84,847,610 | 541,460 |
| 1992 | 27,889,410 | 83,184,690 | 550,990 |
| 1993 | 28,346,970 | 82,282,280 | 552,180 |
| 1994 | 28,708,450 | 81,717,290 | 552,720 |
| 1995 | 29,327,240 | 81,107,570 | 553,470 |
| 1996 | 29,829,720 | 80,266,910 | 556,520 |
| 1997 | 30,300,010 | 79,627,340 | 559,800 |
| 1998 | 30,826,050 | 79,063,390 | 560,870 |
| 1999 | 31,510,800 | 78,786,060 | 568,620 |
| 2000 | 32,158,300 | 79,826,540 | 574,230 |
| 2001 | 32,815,220 | 79,003,560 | 575,220 |
| 2002 | 33,443,530 | 78,452,900 | 582,420 |
| 2003 | 34,164,900 | 77,962,060 | 589,770 |
| 2004 | 34,946,960 | 77,983,530 | 599,680 |
| 2005 | 35,809,370 | 77,710,870 | 614,250 |
| 2006 | 36,596,960 | 78,032,650 | 627,220 |
| 2007 | 37,359,280 | 78,518,800 | 654,920 |
| 2008 | 38,223,060 | 79,234,200 | 669,520 |
| 2009 | 38,935,470 | 79,820,120 | 670,580 |
| 2010 | 39,685,490 | 79,595,720 | 678,430 |
| 2011 | 40,356,070 | 79,627,260 | 680,230 |
| 2012 | 41,002,060 | 81,133,570 | 689,710 |
| 2013 | 41,586,180 | 79,733,360 | 688,740 |
| 2014 | 42,195,590 | 79,331,660 | 683,420 |
| 2015 | 42,660,670 | 78,112,180 | 693,080 |
| 2016 | 42,958,900 | 78,603,850 | 697,150 |
| 2017 | 43,403,060 | 77,407,240 | 695,910 |
| 2018 | 43,626,300 | 74,269,650 | 701,840 |
| 2019 | 43,965,810 | 72,705,330 | 694,710 |
| 2020 | 44,373,660 | 69,047,890 | 684,200 |
| 2021 | 44,892,530 | 67,363,910 | 694,460 |
| 2022 | 45,469,230 | 66,247,780 | 693,810 |
| 2023 | 46,063,890 | 65,645,040 | 693,270 |
Most of those babies were born in India, China, and Indonesia, the world’s first, second, and fourth-most populous countries.
These densely-populated places have always had the agricultural ability to support relatively large populations, but 20th century advances in food science, sanitation, and medicine super-charged that growth.
Additionally, for primarily agrarian economies like India, children are seen as an asset to work farms, securing food supply.
Noticeably, as all three countries industrialized and urbanized, birth rates dropped, and population growth slowed down.
Meanwhile, the number of people being born each year in Africa has only been rising quickly. In 2023, Africa recorded 43 million births. Current UN projections estimate an increase every year until it peaks at 56 million in 2067.
Birth Declines and Aging Populations
Finally, births in other regions have been relatively steady, with slight downtrends seen in Europe, and more recently, Latin America.
| Year | Europe | LatAm & Caribbean |
Northern America |
|---|---|---|---|
| 1950 | 12,167,800 | 7,304,860 | 4,059,310 |
| 1951 | 12,066,150 | 7,491,620 | 4,181,790 |
| 1952 | 12,050,250 | 7,677,260 | 4,292,000 |
| 1953 | 11,993,510 | 7,866,050 | 4,361,150 |
| 1954 | 12,043,690 | 8,056,710 | 4,493,020 |
| 1955 | 12,070,480 | 8,246,050 | 4,523,810 |
| 1956 | 12,059,530 | 8,443,880 | 4,641,050 |
| 1957 | 12,143,270 | 8,637,210 | 4,739,000 |
| 1958 | 12,134,430 | 8,826,020 | 4,802,700 |
| 1959 | 12,222,240 | 9,021,960 | 4,815,510 |
| 1960 | 12,182,190 | 9,214,040 | 4,836,000 |
| 1961 | 12,060,950 | 9,397,350 | 4,840,680 |
| 1962 | 11,763,200 | 9,592,870 | 4,724,190 |
| 1963 | 11,670,820 | 9,771,380 | 4,636,260 |
| 1964 | 11,455,850 | 9,904,930 | 4,564,320 |
| 1965 | 11,101,920 | 10,002,700 | 4,299,400 |
| 1966 | 10,961,780 | 10,080,130 | 4,120,510 |
| 1967 | 10,971,320 | 10,153,580 | 4,004,240 |
| 1968 | 10,777,480 | 10,235,620 | 3,983,160 |
| 1969 | 10,670,280 | 10,347,180 | 4,107,010 |
| 1970 | 10,564,870 | 10,469,250 | 4,252,360 |
| 1971 | 10,642,400 | 10,597,980 | 4,069,270 |
| 1972 | 10,518,440 | 10,716,870 | 3,756,440 |
| 1973 | 10,327,330 | 10,838,500 | 3,636,820 |
| 1974 | 10,443,500 | 10,933,630 | 3,661,140 |
| 1975 | 10,306,750 | 11,050,710 | 3,659,390 |
| 1976 | 10,272,950 | 11,182,990 | 3,687,640 |
| 1977 | 10,198,000 | 11,313,400 | 3,845,640 |
| 1978 | 10,154,630 | 11,429,470 | 3,870,980 |
| 1979 | 10,160,160 | 11,530,100 | 4,015,210 |
| 1980 | 10,195,380 | 11,615,810 | 4,109,850 |
| 1981 | 10,087,310 | 11,720,650 | 4,126,020 |
| 1982 | 10,145,460 | 11,829,890 | 4,176,180 |
| 1983 | 10,201,850 | 11,903,540 | 4,140,980 |
| 1984 | 10,104,770 | 11,943,530 | 4,157,400 |
| 1985 | 10,007,300 | 11,983,060 | 4,218,430 |
| 1986 | 10,118,420 | 12,027,810 | 4,207,080 |
| 1987 | 10,069,800 | 12,006,370 | 4,258,730 |
| 1988 | 9,917,070 | 11,994,580 | 4,359,840 |
| 1989 | 9,574,970 | 12,003,490 | 4,488,530 |
| 1990 | 9,338,610 | 11,999,210 | 4,577,250 |
| 1991 | 8,949,890 | 11,992,910 | 4,523,170 |
| 1992 | 8,553,020 | 11,958,840 | 4,454,300 |
| 1993 | 8,106,490 | 11,979,480 | 4,364,750 |
| 1994 | 7,905,410 | 11,962,500 | 4,296,550 |
| 1995 | 7,695,070 | 11,939,210 | 4,227,490 |
| 1996 | 7,600,870 | 11,873,140 | 4,193,870 |
| 1997 | 7,499,050 | 11,839,590 | 4,159,870 |
| 1998 | 7,414,230 | 11,797,970 | 4,195,020 |
| 1999 | 7,267,160 | 11,713,220 | 4,212,810 |
| 2000 | 7,307,710 | 11,603,540 | 4,288,160 |
| 2001 | 7,248,340 | 11,471,970 | 4,265,690 |
| 2002 | 7,317,800 | 11,343,360 | 4,256,470 |
| 2003 | 7,461,370 | 11,202,880 | 4,319,820 |
| 2004 | 7,580,450 | 11,132,210 | 4,353,500 |
| 2005 | 7,562,330 | 11,069,700 | 4,399,940 |
| 2006 | 7,708,810 | 10,967,920 | 4,535,740 |
| 2007 | 7,906,660 | 10,894,510 | 4,601,610 |
| 2008 | 8,200,940 | 10,868,050 | 4,562,950 |
| 2009 | 8,227,460 | 10,843,680 | 4,471,020 |
| 2010 | 8,236,450 | 10,799,680 | 4,358,460 |
| 2011 | 8,102,070 | 10,790,120 | 4,323,040 |
| 2012 | 8,181,390 | 10,721,090 | 4,327,060 |
| 2013 | 8,013,440 | 10,678,000 | 4,315,050 |
| 2014 | 8,037,360 | 10,648,350 | 4,371,890 |
| 2015 | 7,957,500 | 10,542,290 | 4,368,230 |
| 2016 | 7,933,470 | 10,322,870 | 4,337,860 |
| 2017 | 7,605,380 | 10,238,400 | 4,251,820 |
| 2018 | 7,371,060 | 10,172,140 | 4,191,760 |
| 2019 | 7,127,100 | 9,957,410 | 4,146,440 |
| 2020 | 6,947,410 | 9,660,790 | 4,005,660 |
| 2021 | 6,903,630 | 9,541,940 | 4,052,370 |
| 2022 | 6,520,640 | 9,437,520 | 4,106,410 |
| 2023 | 6,337,700 | 9,354,810 | 4,015,560 |
Note: Northern America is U.S., Bermuda, Canada, Greenland, and St. Pierre and Miquelon. LatAm includes Mexico.
Countries in Europe in particular are aging because of the decline in births, casting doubts over the sustainability of social welfare systems. An aging population can also disrupt the economy, both through the workforce and a shift in demand. Healthcare costs, for example, will increase, raising the requirement for doctors, nurses, and related health workers.
As a result, boosting immigration has become an often–cited solution, though not without its own political and cultural pushbacks.
The post The Number of People Born Every Year, by Region (1950–2023) appeared first on Visual Capitalist.