
Published
4 minutes ago
on
November 27, 2025
| 3 views
-->
By
Jenna Ross
Graphics & Design
- Jennifer West
The following content is sponsored by Terzo
Ranked: AI Hallucination Rates by Model
Key Takeaways
- Many of today’s AI models struggled when asked to identify and cite news sources from an excerpt, producing frequent errors.
- The highest overall AI hallucination rate was 94 % for Grok‑3, indicating nearly all its answers were incorrect.
Does your AI always give you the right answer? Unfortunately, its “truth” may be an illusion.
This infographic breaks down AI hallucination rates by model. It’s a preview of the brand-new executive guide from Terzo and Visual Capitalist, AI’s Illusion of Truth: The Data Behind AI Errors.
What are AI Hallucinations?
An “AI hallucination” refers to cases where a language model presents information as fact even though it is false or ungrounded.
These hallucinations happen because standard training systems reward guessing over showing uncertainty. Think about it this way: if you guess on a multiple choice test, you are more likely to get it right than if you give no answer.
AI Hallucination Rates: The Best and Worst Models
To measure AI hallucination rates, researchers presented models from leading AI companies with news excerpts. They then asked the models to identify the original article, publication, and URL.
Notably, the researchers specifically chose excerpts that, if pasted into a traditional Google search, returned the original source within the first three results.
The models’ responses were then checked for accuracy. Below, the table shows how often each model got an answer partially or entirely incorrect.
| AI Model | Hallucination Rate |
|---|---|
| Perplexity | 37% |
| Copilot | 40% |
| Perplexity Pro | 45% |
| ChatGPT Search | 67% |
| Deepseek Search | 68% |
| Gemini | 76% |
| Grok-2 Search | 77% |
| Grok-3 Search | 94% |
Source: Columbia Journalism Review, March 2025. Responses where no answer was provided were not considered a hallucination.
Grok‑3 had the worst performance, hallucinating 94% of the time. Perplexity, by contrast, delivered the most accurate answers.
Notably, paid models fared worse than their free counterparts. Most models failed to express any uncertainty in their answers, despite frequent errors.
Risks & Implications for Business Leaders
For company executives, the takeaway is clear. It’s risky to take an AI model’s answers at face value. Assuming output is accurate without verification can lead to many negative outcomes:
- Reputational damage
- Financial losses
- Legal exposure
With AI agents, where every action builds on the last, the consequences of AI hallucination can compound quickly. That’s why leaders need strategies to keep humans in the loop, verify output, and use a model that’s built on trusted company data.
![]()
See the data behind AI’s errors and how to get 99% accuracy in the free executive guide, AI’s Illusion of Truth.
More from Terzo
-

AI2 days ago
The Dangers of AI: Visualizing the Top Risks Companies Face
Among the dangers of AI, one stands apart as causing trouble for almost a third of companies. What do leaders need to know?
-

Business1 week ago
Ranked: Which Universities Build the Most Entrepreneurs?
Which university has had the most alumni become entrepreneurs in the last decade? Hint: its not Stanford or Harvard.
-

Economy2 weeks ago
Mapped: Where Workers Are Supporting the Most Seniors
In many advanced economies, the number of retirees is climbing while the working-age population shrinks. What are the countries where workers are supporting the most seniors?
-
Economy3 weeks ago
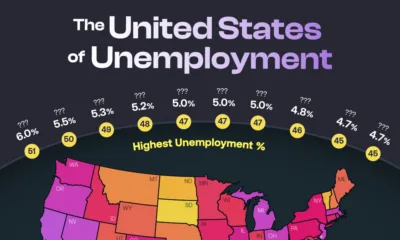
The United States of Unemployment
The national unemployment rate for the U.S. rose to 4.3% in August 2025. But that figure masks vast differences in local labor market health across states.
-

Markets1 month ago
Ranked: The Economies Most Dependent on International Trade
A trade war has threatened economic ties in 2025. Which economies are most exposed to these shifts in international trade?
-

Economy1 month ago
Top Countries Behind U.S. Tariff Revenue
Tariff rates vary by country, as does the value of goods each nation exports to the U.S. Which countries contribute the most?
-

Business2 months ago
Industries Hiring and Firing the Most Employees
As the U.S. labor market cools, which industries are still hiring—and which are cutting back their workforces?
-

Markets2 months ago
The $150T Global Debt Market
Global debt continues to climb, reaching $150T in Q1 2025. Which countries carry the heaviest burdens?
-
Money2 months ago
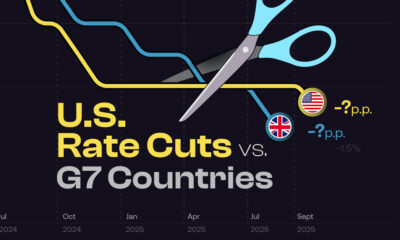
NEW: Fed Rate Cuts vs. Other G7 Countries
How do Fed rate cuts in the U.S. compare with the interest rate changes in other G7 countries, and what does it mean for business?
-
Jobs3 months ago
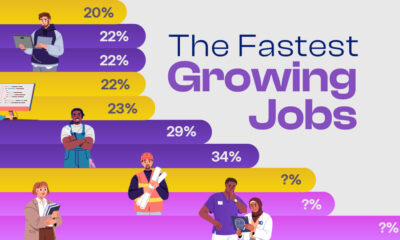
Ranked: The Fastest Growing Jobs (2024-2034)
Explore the fastest growing jobs by projected growth rate, plus salary insights, in a rapidly changing job market.
-

Investor Education3 months ago
The $127 Trillion Global Stock Market in One Giant Chart
This graphic pieces together the $127T global stock market to reveal which countries and regions dominate—and how much equity they control.
-

Personal Finance3 months ago
Late to the Ladder: The Rise in First-Time Home Buyers’ Age
The median age of first-time home buyers has reached a historic high. See just how long it’s taking people to get on the property ladder.
-
Markets4 months ago
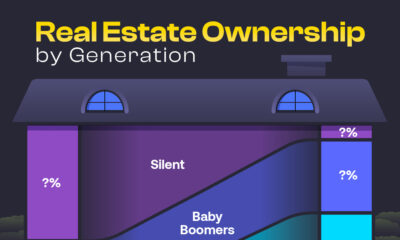
Unpacking Real Estate Ownership by Generation (1991 vs. 2025)
The Silent Generation’s share of real estate has dropped dramatically as people age, but how have Baby Boomers, Gen X, and Millennials fared?
-

Business4 months ago
America’s Economic Engines: The Biggest Industry in Every State
Real estate is the biggest industry by GDP in 26 states. Find out why it dominates—and what fuels the rest of the country.
-
Maps5 months ago
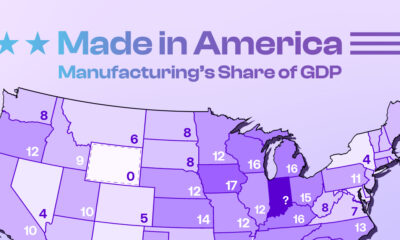
Mapped: Manufacturing as a Share of GDP, by U.S. State
Tariffs are rising to boost American-made goods. Which states gain the most—and least—from manufacturing today?
-

Technology5 months ago
Profit Powerhouses: Ranking The Top 10 U.S. Companies by Net Income
Collectively, the ten most profitable U.S. companies have a net income of $684 billion—more than the entire GDP of Belgium.
-

Money5 months ago
Millionaire Hubs: Mapping the World’s Wealthiest Cities
New York City has the highest millionaire population globally. Which other cities attract the world’s wealthiest?
-
Economy5 months ago
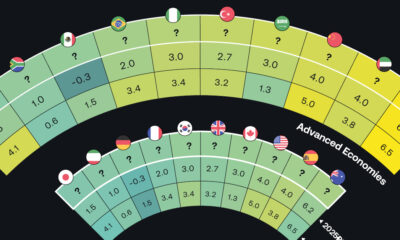
Tomorrow’s Growth: GDP Projections in Key Economies
The global economy is expected to have slighter slower growth going forward. Which countries are on track to have the biggest GDP increases?
-
Money7 months ago
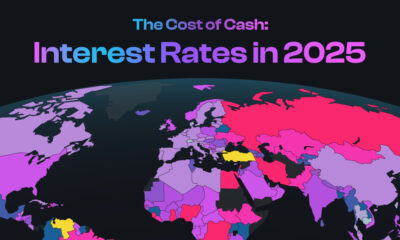
Mapped: Interest Rates by Country in 2025
The U.S. has kept their target rate the same at 4.25-4.50%. What do interest rates look like in other countries amid economic uncertainty?
-
Markets8 months ago
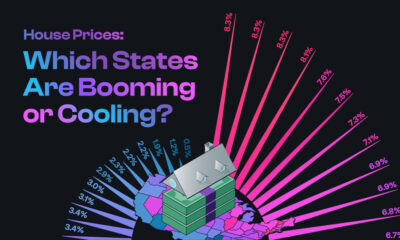
U.S. Housing Prices: Which States Are Booming or Cooling?
The national housing market saw a 4.5% rise in house prices. This graphic reveals which states had high price growth, and which didn’t.
-

Investor Education8 months ago
The Silent Thief: How Inflation Erodes Investment Gains
If you held a $1,000 investment from 1975-2024, this chart shows how the inflation rate can drastically reduce the value of your money.
-

Politics9 months ago
Trade Tug of War: America’s Largest Trade Deficits
Trump cites trade deficits—the U.S. importing more than it exports—as one reason for tariffs. Which countries represent the largest deficits?
Subscribe
Please enable JavaScript in your browser to complete this form.Join 375,000+ email subscribers: *Sign Up