![]()
See this visualization first on the Voronoi app.
Use This Visualization
Mapped: America’s Most Dangerous Cities, According to Citizens
This was originally posted on our Voronoi app. Download the app for free on iOS or Android and discover incredible data-driven charts from a variety of trusted sources.
Key Takeaways
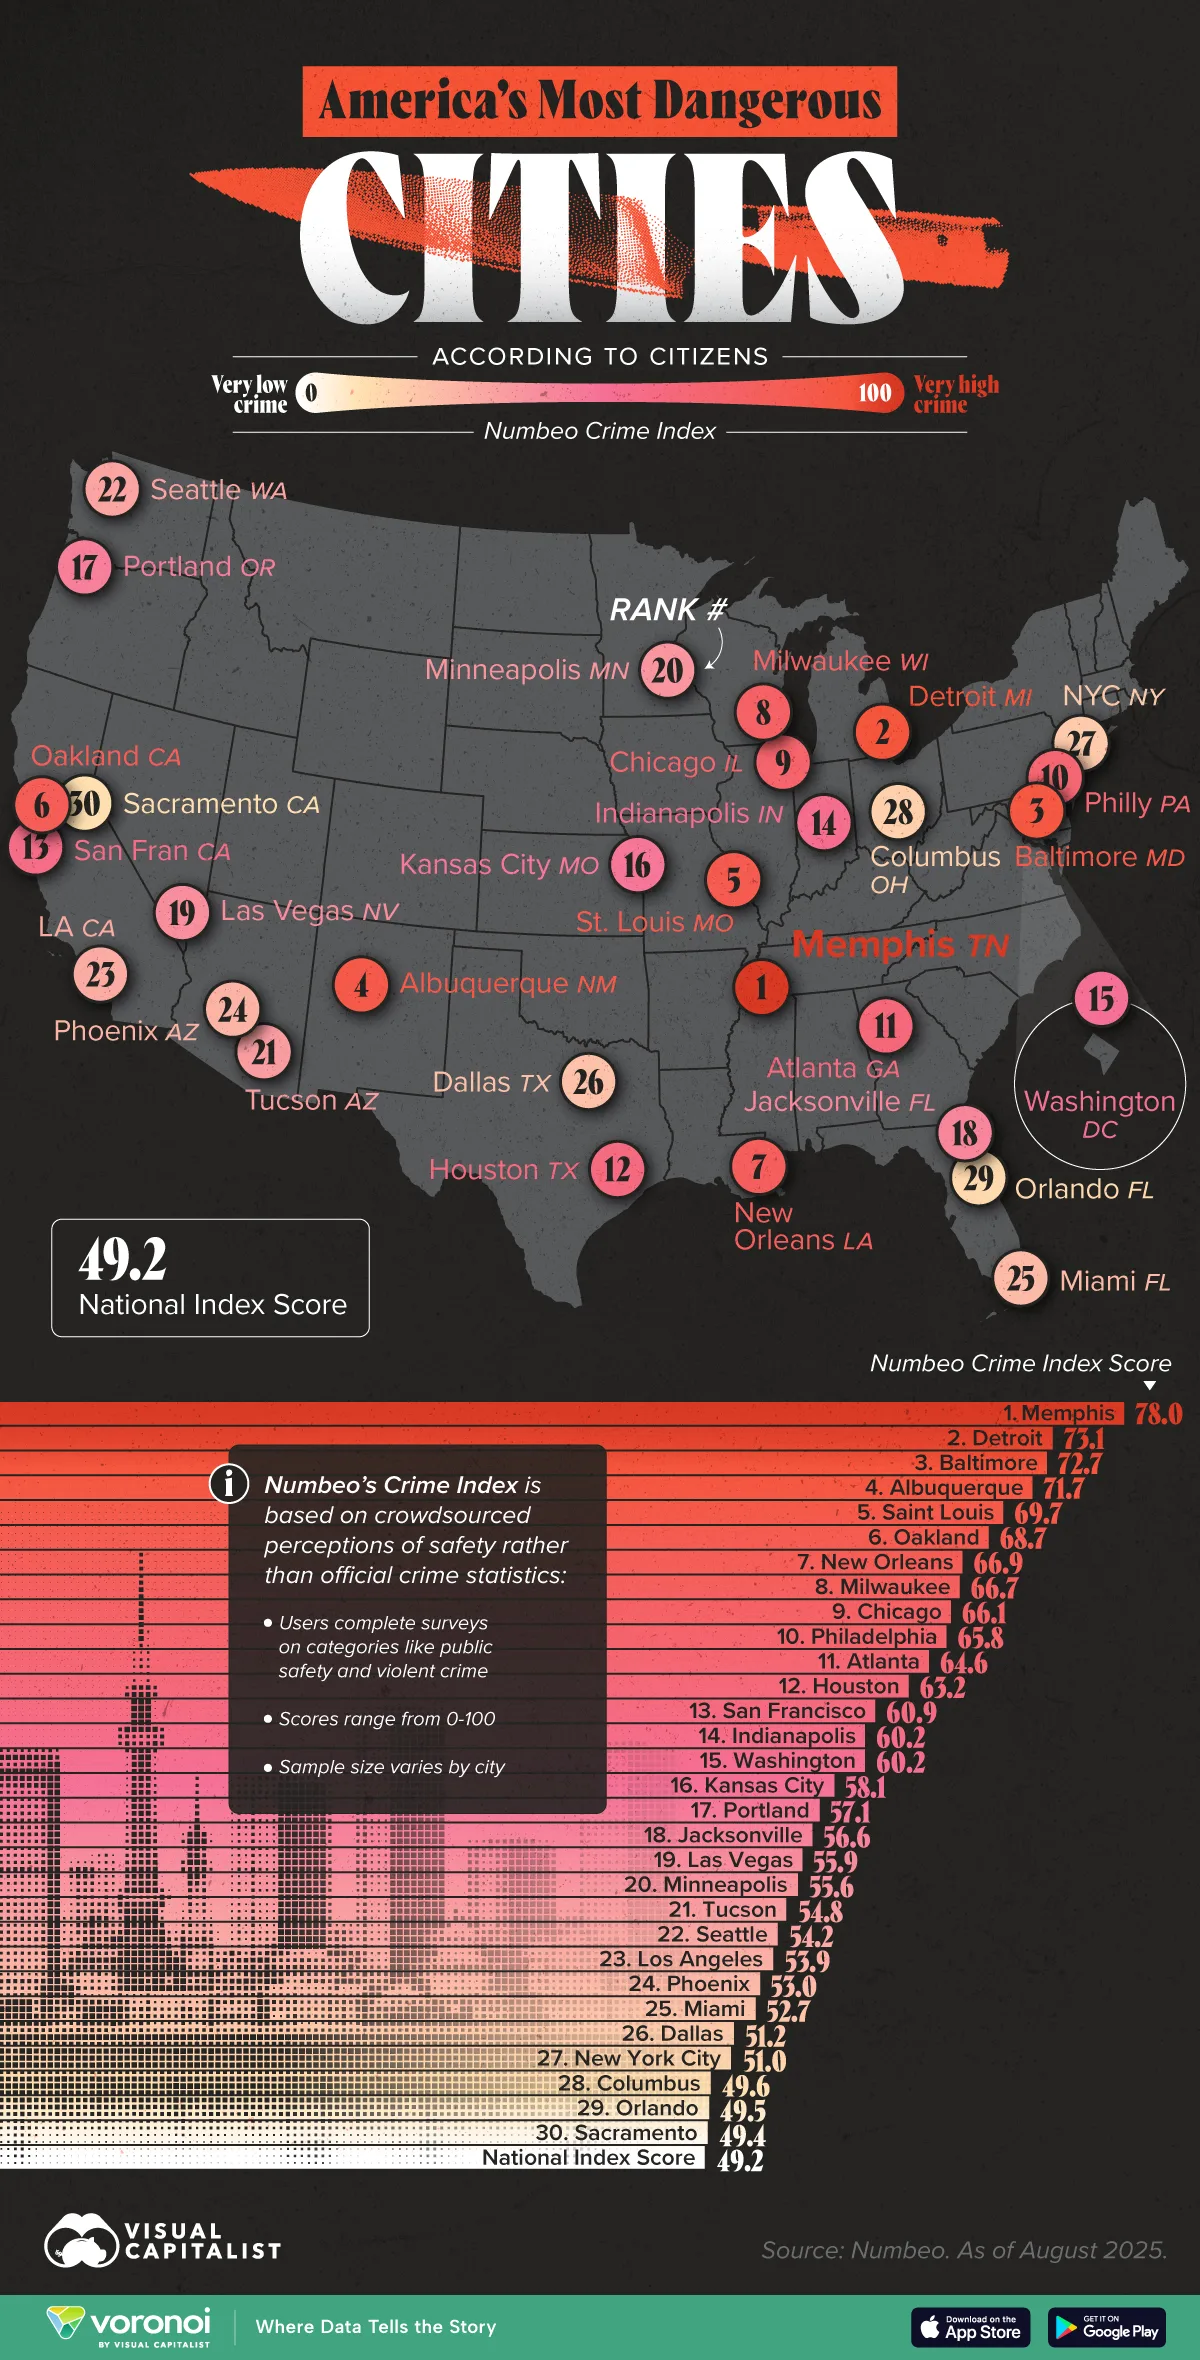
- Numbeo’s Crime Index is based on user surveys, scaled 0–100, and reflects people’s perception of crime & safety rather than official statistics.
- Based on the index’s mid-2025 update, Memphis, TN is the most dangerous city in America.
Where do American’s feel the least safe?
To answer this question, we visualized the results of Numbeo’s Crime Index, which reveals how people perceive safety in their own city as of mid-2025. Unlike FBI or police statistics, this index reflects public sentiment through crowdsourced surveys.
Data & Discussion
Numbeo’s Crime Index uses a scale from 0 (very safe) to 100 (very dangerous), based on residents’ self-reported experiences and perceptions. The survey covers various aspects of crime, including:
- General perception of crime levels
- Perceived safety during day and night
- Concerns about specific crimes (mugging, robbery, car theft, physical attacks, etc.)
- Severity of property crime (burglary, theft, vandalism)
- Severity of violent crime (assault, homicide, sexual offenses)
Overall, this index provides an alternative lens on urban safety that is shaped more by everyday life than by crime reports. Here’s how to interpret the results:
- Very Low Crime: 20 and below
- Low Crime: 20.01-40
- Moderate Crime: 40.01-60
- High Crime: 60.01-80
- Very High Crime: above 80
| Rank | City | State | Crime Index |
|---|---|---|---|
| 1 | Memphis | TN | 78.0 |
| 2 | Detroit | MI | 73.1 |
| 3 | Baltimore | MD | 72.7 |
| 4 | Albuquerque | NM | 71.7 |
| 5 | Saint Louis | MO | 69.7 |
| 6 | Oakland | CA | 68.7 |
| 7 | New Orleans | LA | 66.9 |
| 8 | Milwaukee | WI | 66.7 |
| 9 | Chicago | IL | 66.1 |
| 10 | Philadelphia | PA | 65.8 |
| 11 | Atlanta | GA | 64.6 |
| 12 | Houston | TX | 63.2 |
| 13 | San Francisco | CA | 60.9 |
| 14 | Indianapolis | IN | 60.2 |
| 15 | Washington, DC | DC | 60.2 |
| 16 | Kansas City | MO | 58.1 |
| 17 | Portland | OR | 57.1 |
| 18 | Jacksonville | FL | 56.6 |
| 19 | Las Vegas | NV | 55.9 |
| 20 | Minneapolis | MN | 55.6 |
| 21 | Tucson | AZ | 54.8 |
| 22 | Seattle | WA | 54.2 |
| 23 | Los Angeles | CA | 53.9 |
| 24 | Phoenix | AZ | 53.0 |
| 25 | Miami | FL | 52.7 |
| 26 | Dallas | TX | 51.2 |
| 27 | New York | NY | 51.0 |
| 28 | Columbus | OH | 49.6 |
| 29 | Orlando | FL | 49.5 |
| 30 | Sacramento | CA | 49.4 |
| -- | National Index Score | -- | 49.2 |
Memphis Leads the Rankings
At the top of the list, Memphis, Tennessee registers the highest crime index score at 78, marking it as the city Americans perceive as the most unsafe in 2025.
Residents often cite issues with violent crime and property theft, contributing to its elevated perception of risk.
While Memphis has historically suffered from high crime rates, recent data shows safety is improving. In 2024, total crime in Memphis dropped by roughly 13.3%, with homicide down about 30% and motor vehicle theft down nearly 39%.
Rust Belt and Legacy Crime Centers
Detroit (73.1) and Baltimore (72.7) continue to rank among the top three most dangerous cities in the index.
Since 2008, both cities have struggled with the loss of key industries and jobs, eroding their economic base (and tax revenues). This fuels an increase in poverty rates, reduces the city’s capacity to respond, and destabilizes communities.
Learn More on the Voronoi App ![]()
If you enjoyed today’s post, check out Organized Crime Hot Spots Around the World on Voronoi, the new app from Visual Capitalist.