![]()
See more visuals like this on the Voronoi app.
Use This Visualization
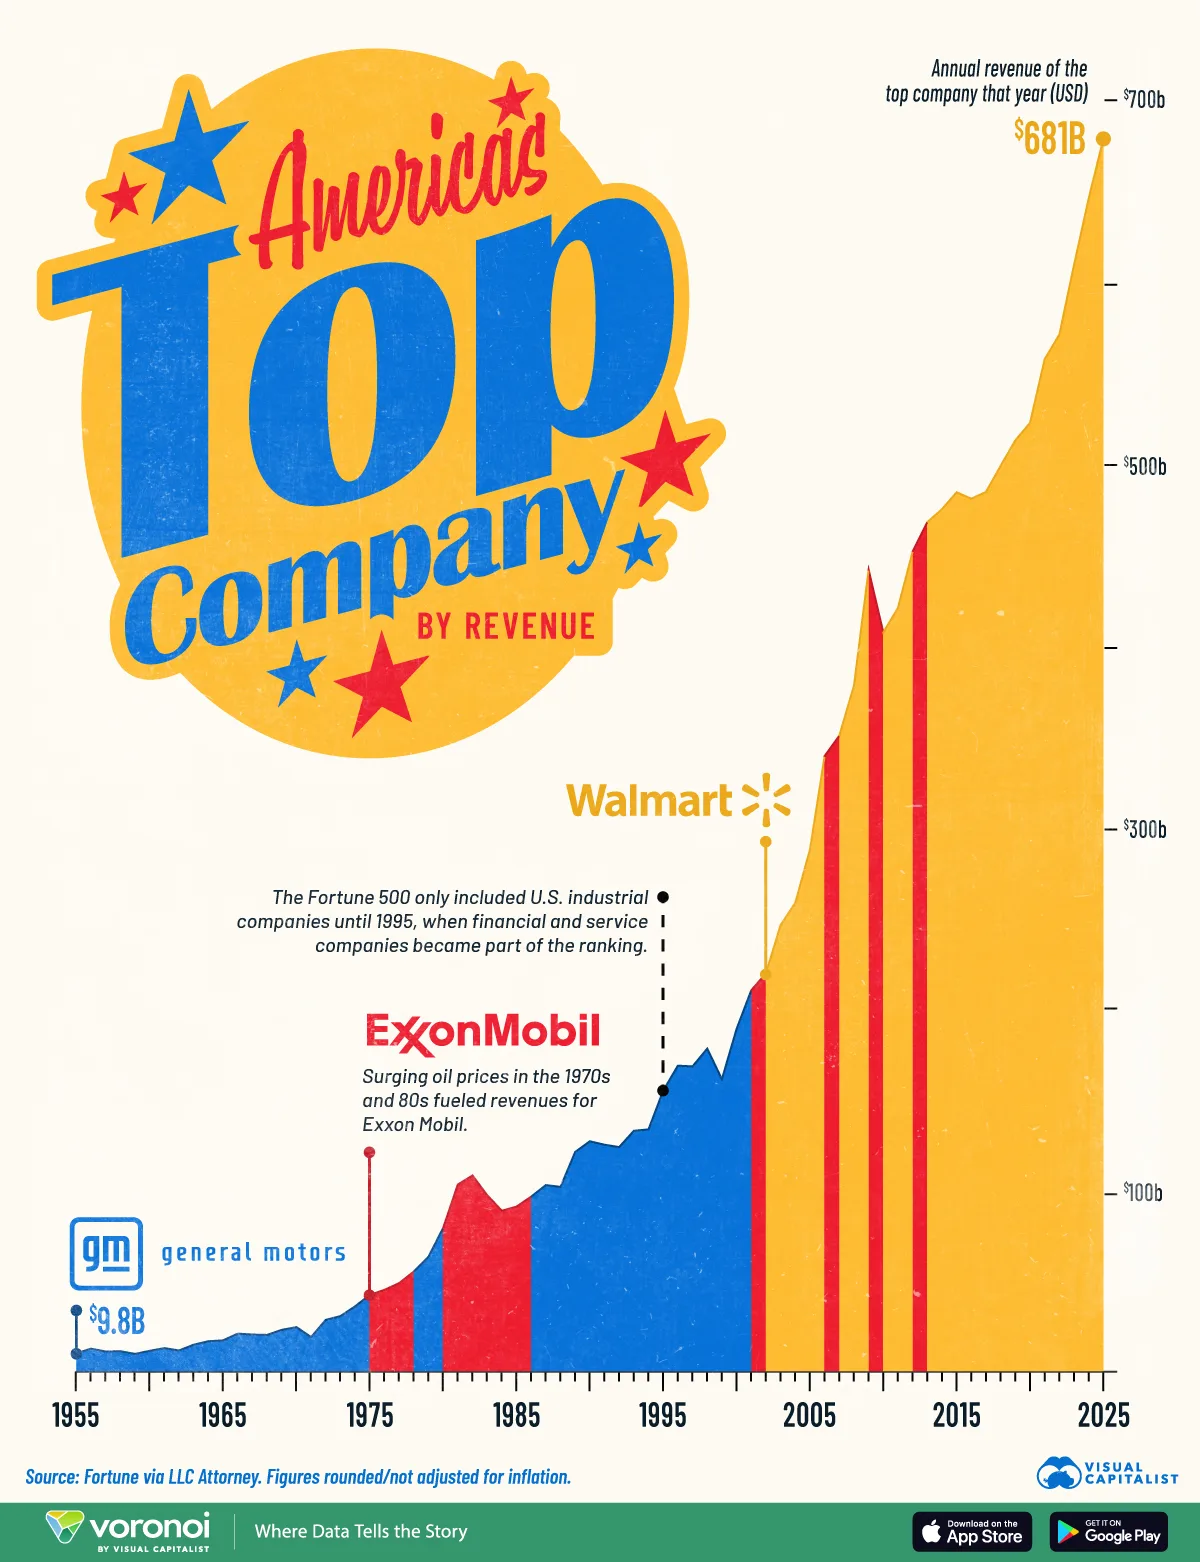
America’s Top Company by Revenue, Over Time (1955–2025)
See visuals like this from many other data creators on our Voronoi app. Download it for free on iOS or Android and discover incredible data-driven charts from a variety of trusted sources.
Key Takeaways
- General Motors (GM) dominated for nearly 40 years, leading America’s revenue rankings from 1955 through the 1990s.
- ExxonMobil overtook GM during oil boom periods in the 1970s, 1980s, and 2000s.
- Walmart has held the top spot for 21 of the last 25 years, and now generates over $680 billion annually.
America’s corporate landscape has transformed dramatically over the last century.
From the industrial powerhouses of the mid-20th century to today’s retail and tech titans, the companies leading by revenue reveal how the U.S. economy itself has evolved.
This graphic uses data from the Fortune 500 via LLC Attorney to chart America’s top company by annual revenue from 1955 to 2025. Revenue figures are not adjusted for inflation.
From General Motors to Walmart
For decades, automobile giant GM was the unrivaled leader of American industry.
From 1955 to 1974, GM topped the Fortune 500 every single year, fueled by the postwar auto boom and the dominance of U.S. manufacturing. Its revenues rose from just $9.8 billion in 1955 to $35.8 billion by 1974. That’s worth nearly $249 billion in 2025 after adjusting for inflation.
| Year | Top revenue company in the U.S. | Annual revenue of the top company (USD, billions) |
|---|---|---|
| 1955 | General Motors | $9.8 |
| 1956 | General Motors | $12.4 |
| 1957 | General Motors | $10.8 |
| 1958 | General Motors | $11.0 |
| 1959 | General Motors | $9.5 |
| 1960 | General Motors | $11.2 |
| 1961 | General Motors | $12.7 |
| 1962 | General Motors | $11.4 |
| 1963 | General Motors | $14.6 |
| 1964 | General Motors | $16.5 |
| 1965 | General Motors | $17.0 |
| 1966 | General Motors | $20.7 |
| 1967 | General Motors | $20.2 |
| 1968 | General Motors | $20.0 |
| 1969 | General Motors | $22.8 |
| 1970 | General Motors | $24.3 |
| 1971 | General Motors | $18.8 |
| 1972 | General Motors | $28.3 |
| 1973 | General Motors | $30.4 |
| 1974 | General Motors | $35.8 |
| 1975 | Exxon Mobil | $42.1 |
| 1976 | Exxon Mobil | $44.9 |
| 1977 | Exxon Mobil | $48.6 |
| 1978 | General Motors | $55.0 |
| 1979 | General Motors | $63.2 |
| 1980 | Exxon Mobil | $79.1 |
| 1981 | Exxon Mobil | $103.1 |
| 1982 | Exxon Mobil | $108.1 |
| 1983 | Exxon Mobil | $97.2 |
| 1984 | Exxon Mobil | $88.6 |
| 1985 | Exxon Mobil | $90.9 |
| 1986 | General Motors | $96.4 |
| 1987 | General Motors | $102.8 |
| 1988 | General Motors | $101.8 |
| 1989 | General Motors | $121.1 |
| 1990 | General Motors | $127.0 |
| 1991 | General Motors | $125.1 |
| 1992 | General Motors | $123.8 |
| 1993 | General Motors | $132.8 |
| 1994 | General Motors | $133.6 |
| 1995 | General Motors | $155.0 |
| 1996 | General Motors | $168.8 |
| 1997 | General Motors | $168.4 |
| 1998 | General Motors | $178.2 |
| 1999 | General Motors | $161.3 |
| 2000 | General Motors | $189.1 |
| 2001 | Exxon Mobil | $210.4 |
| 2002 | Walmart | $219.8 |
| 2003 | Walmart | $246.5 |
| 2004 | Walmart | $258.7 |
| 2005 | Walmart | $288.2 |
| 2006 | Exxon Mobil | $339.9 |
| 2007 | Walmart | $351.1 |
| 2008 | Walmart | $378.8 |
| 2009 | Exxon Mobil | $442.9 |
| 2010 | Walmart | $408.2 |
| 2011 | Walmart | $421.8 |
| 2012 | Exxon Mobil | $452.9 |
| 2013 | Walmart | $469.2 |
| 2014 | Walmart | $476.3 |
| 2015 | Walmart | $485.7 |
| 2016 | Walmart | $482.1 |
| 2017 | Walmart | $485.9 |
| 2018 | Walmart | $500.3 |
| 2019 | Walmart | $514.4 |
| 2020 | Walmart | $524.0 |
| 2021 | Walmart | $559.2 |
| 2022 | Walmart | $572.8 |
| 2023 | Walmart | $611.3 |
| 2024 | Walmart | $648.1 |
| 2025 | Walmart | $681.0 |
Following GM’s dominance, ExxonMobil emerged as the new leader in the 1970s and 1980s. Surging oil prices during the energy crises pushed the petroleum giant ahead, and it frequently traded the top spot with GM across the next two decades.
It’s also important to note that the Fortune 500 included only U.S. industrial companies until 1995, when financial and service companies became part of the ranking.
By the early 2000s, Walmart took the baton, building its dominance based on its massive scale of operations. Walmart became America’s top company by revenue in 2002, generating $220 billion at the time. Two decades later, it has nearly tripled that figure to over $680 billion in 2025, while claiming the top spot for 21 of the last 25 years.
How America’s Corporate Giants Have Shifted
The long-term trends tell the story of America’s shifting economic priorities. The 20th century was led by manufacturing, the early 21st century by energy, and the current era by retail, logistics, and technology.
Even as tech companies like Apple and Amazon climb the ranks, Walmart’s unmatched global distribution network and sheer scale have kept it firmly ahead. Meanwhile, ExxonMobil remains one of the few industrial-era leaders still near the top, underscoring the enduring strength of the energy sector.
Over time, these trends highlight how the definition of “big business” in America has evolved—from factories and oil fields to logistics and consumer goods.
Learn More on the Voronoi App ![]()
If you enjoyed today’s post, check out America’s Top 25 Companies by Revenue in 2025 on Voronoi, the new app from Visual Capitalist.