![]()
See this visualization first on the Voronoi app.
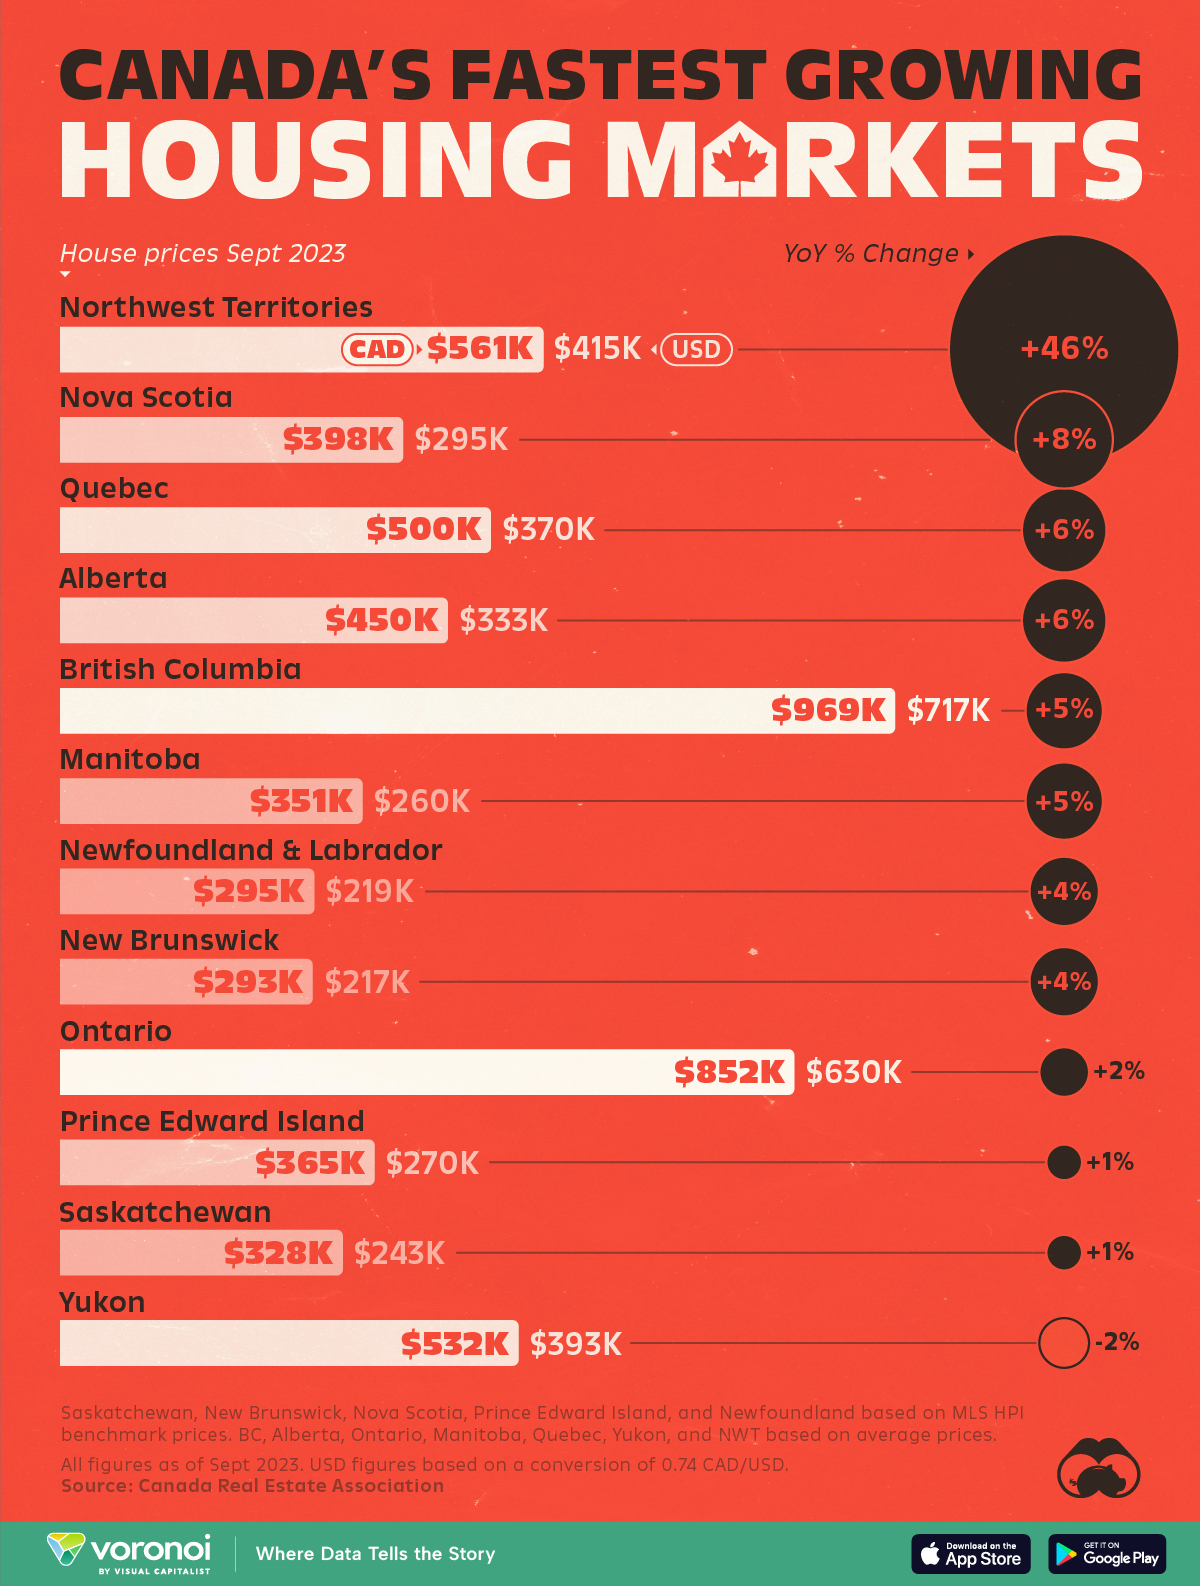
Ranked: Canada’s Housing Markets By Price Growth in 2023
This was originally posted on our Voronoi app. Download the app for free on iOS or Android and discover incredible data-driven charts from a variety of trusted sources.
Between 2010 and 2022, real Canadian housing prices jumped 90%, making Canada one of the most expensive and unaffordable housing markets in the world.
We visualize the average price of housing across Canada’s provinces and territories in 2023 (excluding Nunavut), based on data from the Canada Real Estate Association (CREA).
The data visualized above is a mix of averages provided by provincial organizations to CREA as well as benchmarks found using CREA’s MLS® HPI tool. Data from the MLS tool is labeled with an asterisk in the below table, and the methodology behind how it is calculated can be found here.
A “benchmark home” is one whose attributes are typical of homes traded in the area where it’s located, and provides a more accurate price as it accounts for hidden attributes, like above-ground-living-area square footage, presence of unfinished basements, etc.
All prices in this article are in Canadian dollars (CAD). The chart above adds in the U.S. dollar (USD) equivalent based on a 0.74 CAD/USD conversion rate.
One Canadian Housing Market is Not Slowing Down
The average price of a house in the Northwest Territories (NWT) comfortably crossed half a million dollars in September, 2023, a 40% jump from $385,500 a year earlier.
However a house in NWT still costs below the country-wide average of $640,000.
Here’s how the rest of Canada’s housing markets did between September 2022–23, ranked by percentage price growth.
| Rank | Province / Territory | Average House Price (Sept 2022, CAD) |
Average House Price (Sept 2023, CAD) |
YoY Change |
|---|---|---|---|---|
| 1 | Northwest Territories | $385,492 | $561,080 | +46% |
| 2 | Novia Scotia* | $370,000 | $398,000 | +8% |
| 3 | Quebec | $470,108 | $499,911 | +6% |
| 4 | Alberta | $425,132 | $450,105 | +6% |
| 5 | British Columbia | $922,152 | $969,306 | +5% |
| 6 | Manitoba | $335,488 | $351,445 | +5% |
| 7 | Newfoundland & Labrador |
$285,100 | $295,400 | +4% |
| 8 | New Brunswick* | $280,600 | $292,600 | +4% |
| 9 | Ontario | $835,848 | $851,756 | +2% |
| 10 | Prince Edward Island* | $362,300 | $365,200 | +1% |
| 11 | Saskatchewan* | $324,500 | $328,000 | +1% |
| 12 | Yukon | $541,363 | $531,609 | -2% |
Note: *Data from MLS® HPI tool. Other data are average prices. Nunavut data not available from the source.
The price boom in NWT, which picked up pace during the pandemic, is due to a lack of supply and new construction. The territory has also seen greater wildfire risk over the years—in 2023, nearly 70% of the population faced displacement due to encroaching fires. Over the long, hot summer, wildfires wiped out towns and forced the entire city of Yellowknife (population 20,000) to evacuate for three weeks.
The federal government has promised the construction of 50 new affordable homes to mitigate some of the destruction.
While no other housing market has mirrored what’s happening in NWT, every one of them, except the Yukon has seen some sort of price growth.
For British Columbia, and Ontario—the country’s most expensive regions—prices are closer to $1 million than not. Their biggest cities, Vancouver and Toronto routinely feature in annual reports on real estate bubbles around the world.
However, both regions have recently seen a housing supply surge which may cause prices to drop as much as 10% in 2024—still leaving them 15% higher than before the pandemic.
The post Ranked: Canada’s Housing Markets, by Price Growth in 2023 appeared first on Visual Capitalist.