![]()
See this visualization first on the Voronoi app.
Use This Visualization
Ranked: States With the Strongest Public Pensions in 2025
This was originally posted on our Voronoi app. Download the app for free on iOS or Android and discover incredible data-driven charts from a variety of trusted sources.
Key Takeaways
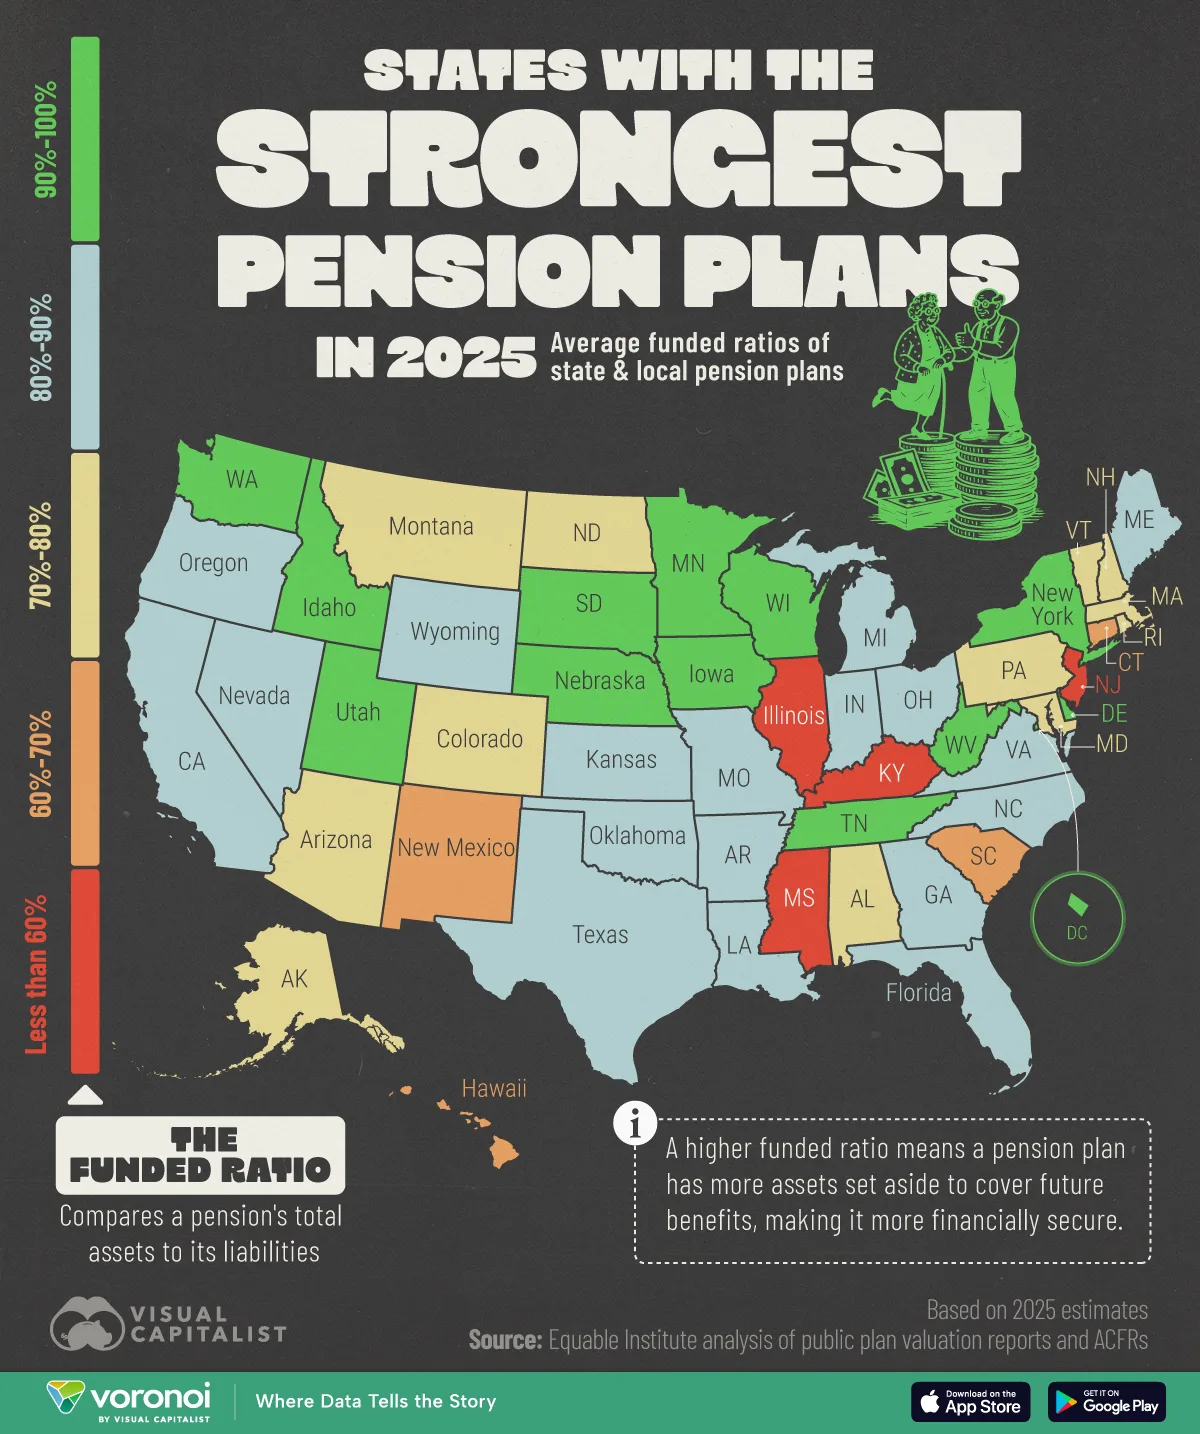
- The funded ratio compares a pension plan’s assets to its liabilities, showing how prepared each state is to meet its future retirement promises.
- A higher funded ratio means a pension plan has more assets set aside to cover future benefits, making it more financially secure.
Public pension health varies widely across the U.S., and 2025 estimates shows a clear divide between states with strong fiscal management and those still struggling to meet retirement promises.
In this visualization, we rank all 50 states (and D.C.) by the average funded ratio of their local pension plans, which measures how much of their pension obligations are backed by assets.
Data & Discussion
The data for this visualization comes from Equable.
A funded ratio of 100% means a state can fully meet its future pension obligations, while lower ratios indicate potential fiscal challenges that may require increased contributions or benefit adjustments. Pensions with less than 60% funding are classified as “distressed”.
| State | Percentage Range |
|---|---|
| Illinois | Less than 60% |
| Kentucky | Less than 60% |
| Mississippi | Less than 60% |
| New Jersey | Less than 60% |
| Connecticut | 60% - 70% |
| Hawaii | 60% - 70% |
| New Mexico | 60% - 70% |
| South Carolina | 60% - 70% |
| Alabama | 70% - 80% |
| Alaska | 70% - 80% |
| Arizona | 70% - 80% |
| Colorado | 70% - 80% |
| Maryland | 70% - 80% |
| Massachusetts | 70% - 80% |
| Montana | 70% - 80% |
| New Hampshire | 70% - 80% |
| North Dakota | 70% - 80% |
| Pennsylvania | 70% - 80% |
| Rhode Island | 70% - 80% |
| Vermont | 70% - 80% |
| Arkansas | 80% - 90% |
| California | 80% - 90% |
| Florida | 80% - 90% |
| Georgia | 80% - 90% |
| Indiana | 80% - 90% |
| Kansas | 80% - 90% |
| Louisiana | 80% - 90% |
| Maine | 80% - 90% |
| Michigan | 80% - 90% |
| Missouri | 80% - 90% |
| Nevada | 80% - 90% |
| North Carolina | 80% - 90% |
| Ohio | 80% - 90% |
| Oklahoma | 80% - 90% |
| Oregon | 80% - 90% |
| Texas | 80% - 90% |
| Virginia | 80% - 90% |
| Wyoming | 80% - 90% |
| DC | 90% - 100% |
| Delaware | 90% - 100% |
| Idaho | 90% - 100% |
| Iowa | 90% - 100% |
| Minnesota | 90% - 100% |
| Nebraska | 90% - 100% |
| New York | 90% - 100% |
| South Dakota | 90% - 100% |
| Tennessee | 90% - 100% |
| Utah | 90% - 100% |
| Washington | 90% - 100% |
| West Virginia | 90% - 100% |
| Wisconsin | 90% - 100% |
States in Distressed Status
Based on 2025 estimates, four states remain in a distressed status with less than 60% funding: New Jersey, Illinois, Kentucky, and Mississippi.
According to some sources, New Jersey’s pensions have the lowest funded ratios in America due to several factors:
- Failure to make required payments: The state has regularly fallen behind on making required payments into the system
- Benefit increases: Past administrations have increased benefits without establishing a concrete plan to fund them
- Use of borrowing: Pensions have borrowed money to pay for their obligations, creating an additional debt burden
Illinois is also in a dire situation, with Chicago pensions growing their unfunded liabilities from $11 billion in 2001, to $56 billion in 2024.
The Top Three Causes of Unfunded Liabilities
According to Equable, the three primary reasons pensions are falling behind are assumption changes, investment experience, and interest on debt.
Managing pension plans requires a wide range of assumptions about future events: investment returns, mortality rates, workforce turnover, salary growth, inflation, government contributions, and more. There are lots of places where reality may not line up with actuarial expectations.
State of Pensions 2025
For example, in 2023, America’s public pension plans faced a collective $1.3 trillion in unfunded liabilities. Of this amount, 36% was due to “assumption changes”, which refers to adjustments in key actuarial assumptions.
When metrics like life expectancy rise, pension plans must pay their retirees benefits for longer than originally expected.
The second major reason, “investment experience”, accounts for 29% of the $1.3 trillion shortfall. Pension plans have faced high investment return volatility since the Global Financial Crisis, making it difficult to manage cash flows.
Finally, the third major reason is “interest on debt”, representing 22% of the shortfall. Equable reports that America’s public pensions have been underfunded for nearly two decades, and interest payments on debt are growing faster than the member contributions they collect.
Learn More on the Voronoi App ![]()
If you enjoyed today’s post, check out Which States Have the Highest Share of Retirement-Age Workers? on Voronoi, the new app from Visual Capitalist.