![]()
See more visualizations like this on the Voronoi app.
Use This Visualization
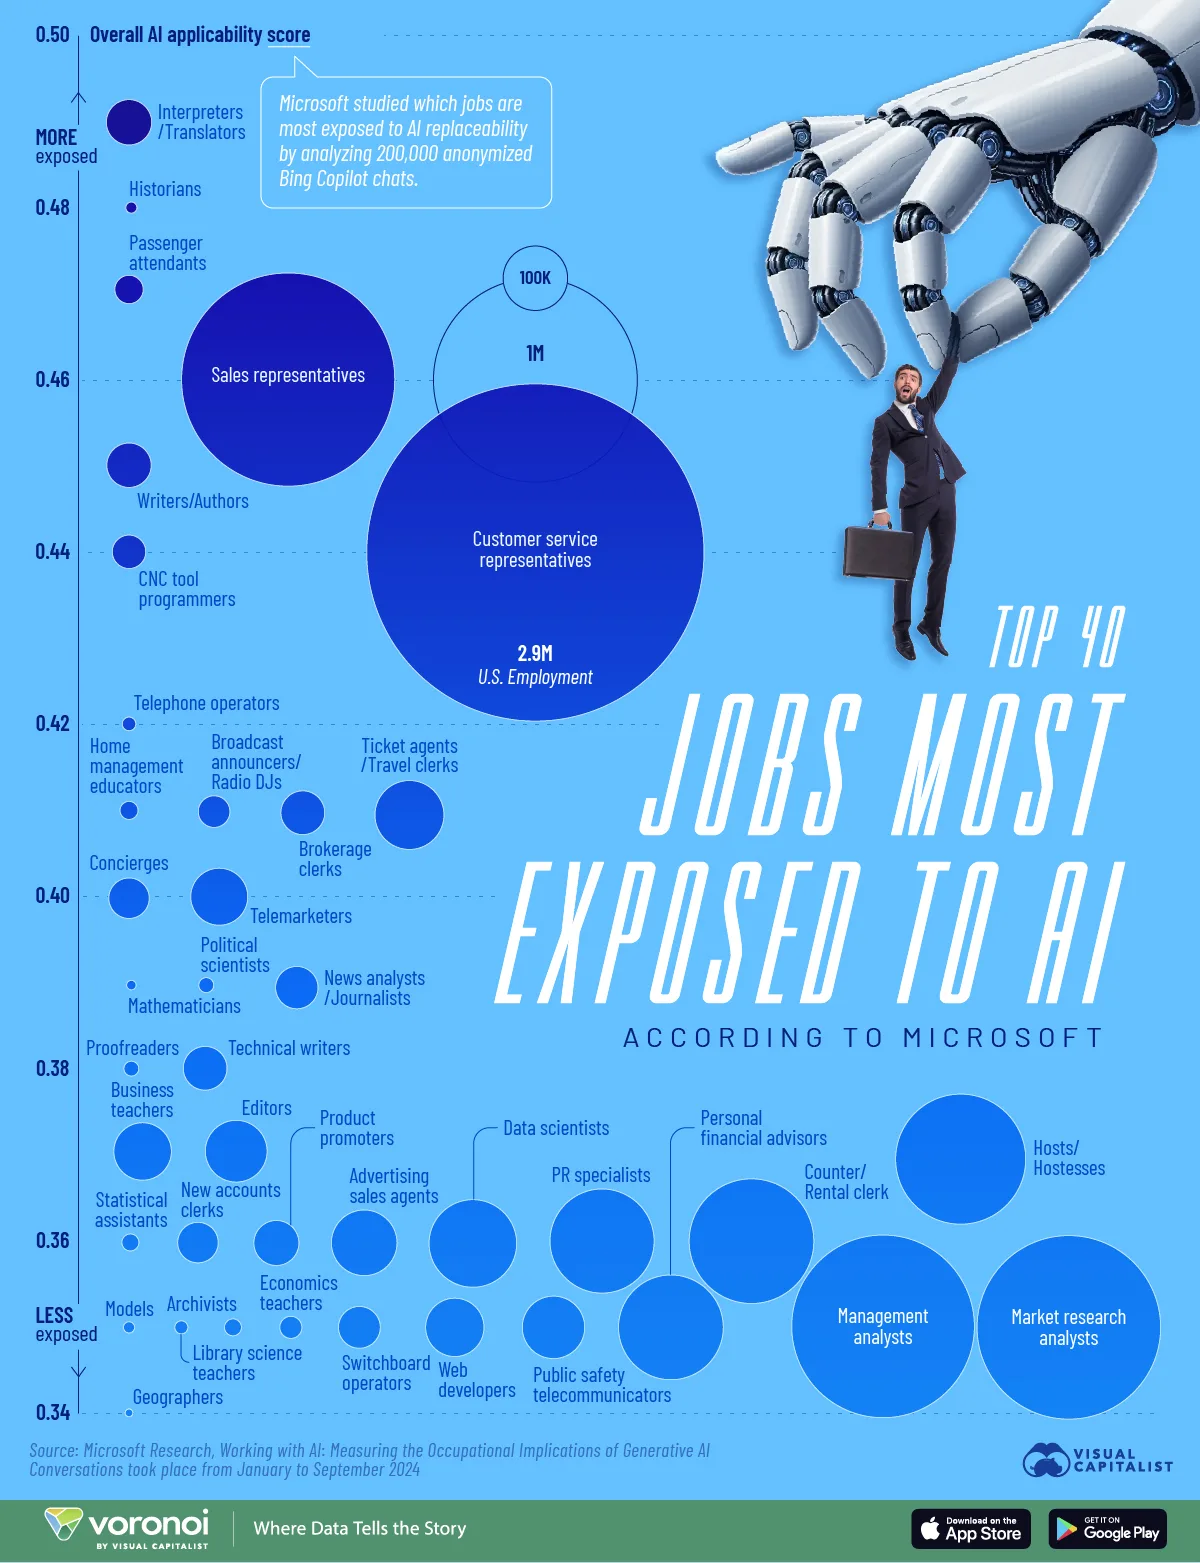
Visualizing the Top 40 Jobs at Risk From AI
See visuals like this from many other data creators on our Voronoi app. Download it for free on iOS or Android and discover incredible data-driven charts from a variety of trusted sources.
Key Takeaways
- Interpreters and translators had the highest job exposure to AI, along with several knowledge occupations.
- Passenger attendants and sales representatives also ranked in the top five most exposed.
AI adoption is growing rapidly worldwide, with machines having a growing capability of performing work tasks that overlap with a number of occupations.
It’s still the Wild West out there, and it’s unclear exactly how AI will ultimately affect the workplace. Will it become our assistant for everything, or will it eliminate jobs entirely?
This graphic is based on data from Microsoft Research, which analyzed how people used AI and how closely these tasks correspond with occupational activities.
The Data Behind Jobs at Risk from AI
For the analysis, Microsoft assessed 200,000 U.S. user conversations on Copilot in 2024.
Conversations were measured by how well AI performed tasks. Secondly, it analyzed a task’s applicability to each job. Each job was then given an overall score based on these metrics, where a higher score indicated higher exposure to AI.
| Job title | Overall score | Number of people employed in the U.S. |
|---|---|---|
| Interpreters and Translators | 0.49 | 51,560 |
| Historians | 0.48 | 3,040 |
| Passenger Attendants | 0.47 | 20,190 |
| Sales Representatives of Services | 0.46 | 1,142,020 |
| Writers and Authors | 0.45 | 49,450 |
| CNC Tool Programmers | 0.44 | 28,030 |
| Customer Service Representatives | 0.44 | 2,858,710 |
| Telephone Operators | 0.42 | 4,600 |
| Farm and Home Management Educators | 0.41 | 8,110 |
| Broadcast Announcers and Radio DJs | 0.41 | 25,070 |
| Brokerage Clerks | 0.41 | 48,060 |
| Ticket Agents and Travel Clerks | 0.41 | 119,270 |
| Concierges | 0.4 | 41,020 |
| Telemarketers | 0.4 | 81,580 |
| Mathematicians | 0.39 | 2,220 |
| Political Scientists | 0.39 | 5,580 |
| News Analysts, Reporters, Journalists | 0.39 | 45,020 |
| Proofreaders and Copy Markers | 0.38 | 5,490 |
| Technical Writers | 0.38 | 47,970 |
| Business Teachers, Postsecondary | 0.37 | 82,980 |
| Editors | 0.37 | 95,700 |
| Hosts and Hostesses | 0.37 | 425,020 |
| Statistical Assistants | 0.36 | 7,200 |
| New Accounts Clerks | 0.36 | 41,180 |
| Demonstrators and Product Promoters | 0.36 | 50,790 |
| Advertising Sales Agents | 0.36 | 108,100 |
| Data Scientists | 0.36 | 192,710 |
| Public Relations Specialists | 0.36 | 275,550 |
| Counter and Rental Clerks | 0.36 | 390,300 |
| Geographers | 0.35 | 1,460 |
| Models | 0.35 | 3,090 |
| Archivists | 0.35 | 7,150 |
| Economics Teachers, Postsecondary | 0.35 | 12,210 |
| Switchboard Operators | 0.35 | 43,830 |
| Web Developers | 0.35 | 85,350 |
| Public Safety Telecommunicators | 0.35 | 97,820 |
| Personal Financial Advisors | 0.35 | 272,190 |
| Management Analysts | 0.35 | 838,140 |
| Market Research Analysts | 0.35 | 846,370 |
| Library Science Teachers, Postsecondary | 0.34 | 4,220 |
Interpreters and translators rank first overall, as 98% of work functions corresponded with Copilot conversations with relatively strong completion rates.
As we can see, several knowledge workers like historians and writers had high levels of overlap. Meanwhile, passenger attendants and customer service representatives—which together represent nearly three million jobs in America—rank among the top 10.
Interestingly, hosts and hostesses illustrated a high exposure, however whether both restaurant owners and customers would enjoy a machine performing functions in a dining environment remains questionable, at least in today’s world.
Learn More on the Voronoi App ![]()
To learn more about this topic, check out this graphic on the jobs that are safest from AI.