![]()
See this visualization first on the Voronoi app.
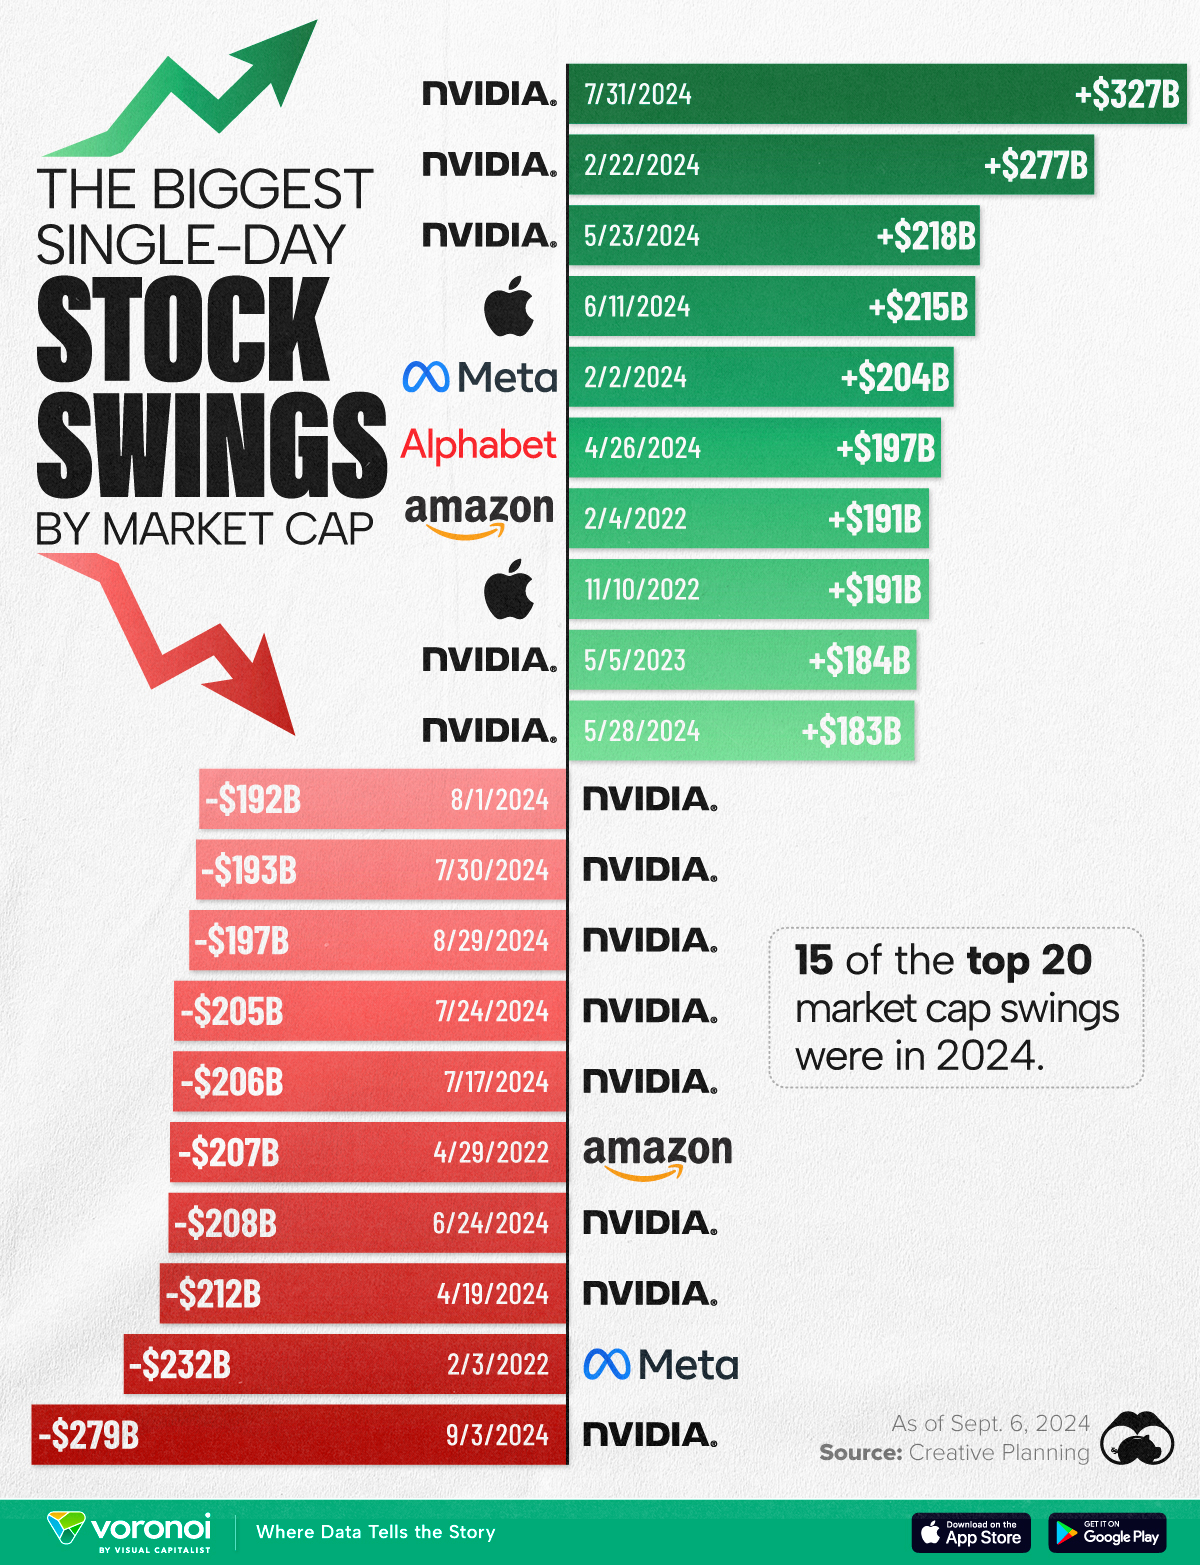
Ranking the Biggest Single-Day Stock Swings of All Time
This was originally posted on our Voronoi app. Download the app for free on iOS or Android and discover incredible data-driven charts from a variety of trusted sources.
In this graphic, we’ve ranked the biggest single-day stock swings in U.S. history, by total change in market capitalization in U.S. dollars. These numbers were sourced from the blog of Charlie Bilello, Chief Market Strategist at Creative Planning.
Data and Highlights
All of the numbers we used to create this graphic are listed in the tables below, starting with single-day market cap gains.
| Date | Stock | Single-day Gain |
|---|---|---|
| 7/31/2024 | Nvidia | $327B |
| 2/22/2024 | Nvidia | $277B |
| 5/23/2024 | Nvidia | $218B |
| 6/11/2024 | Apple | $215B |
| 2/2/2024 | Meta | $204B |
| 4/26/2024 | $197B | |
| 2/4/2022 | Amazon | $191B |
| 11/10/2022 | Apple | $191B |
| 5/5/2023 | Nvidia | $184B |
| 5/28/2024 | Nvidia | $183B |
Many of these single-day gains are related to news around artificial intelligence.
For instance, on July 31, 2024, Nvidia jumped 12%, gaining a massive $327 billion in market cap. This was due to better-than-expected results posted by AMD, another U.S. semiconductor company with a focus on artificial intelligence (AI).
A few weeks earlier on June 11, 2024, Apple shares recorded their best day since 2022 after the company revealed its on-device AI system, Apple Intelligence.
Next, let’s look at the biggest single-day market cap losses in U.S. history.
| Date | Stock | Single-day Loss |
|---|---|---|
| 9/3/2024 | Nvidia | $279B |
| 2/3/2022 | Meta | $232B |
| 4/19/2024 | Nvidia | $212B |
| 6/24/2024 | Nvidia | $208B |
| 4/29/2022 | Amazon | $207B |
| 7/17/2024 | Nvidia | $206B |
| 7/24/2024 | Nvidia | $205B |
| 8/29/2024 | Nvidia | $197B |
| 7/30/2024 | Nvidia | $193B |
| 8/1/2024 | Nvidia | $192B |
Again, we can see that all of these losses were recorded in the past few years. Given today’s multi-trillion dollar valuations, billions in company market cap can be gained or wiped out in a single day.
Volatility in 2024
2024 is proving to be a volatile year for tech stocks, particularly Nvidia, as investors have recently rotated into more defensive sectors like Utilities and Consumer Staples. For reference, the S&P 500’s utilities sector has climbed over 21% YTD in 2024.
Looking at the Nasdaq-100 index, we can see the beginning of a “falling tops” pattern since July 2024, meaning each peak in price is lower than the previous peak. Falling tops typically indicate a bearish trend.
Learn More on the Voronoi App ![]()
If you enjoy graphics like these, check out Ehsan Soltani’s profile on Voronoi, the new app from Visual Capitalist. Ehsan is an economist with 400+ articles in various journals and newspapers, and a regular poster on Voronoi.
The post Ranking the Biggest Single-Day Stock Swings of All Time appeared first on Visual Capitalist.