![]() See this visualization first on the Voronoi app.
See this visualization first on the Voronoi app.
Use This Visualization
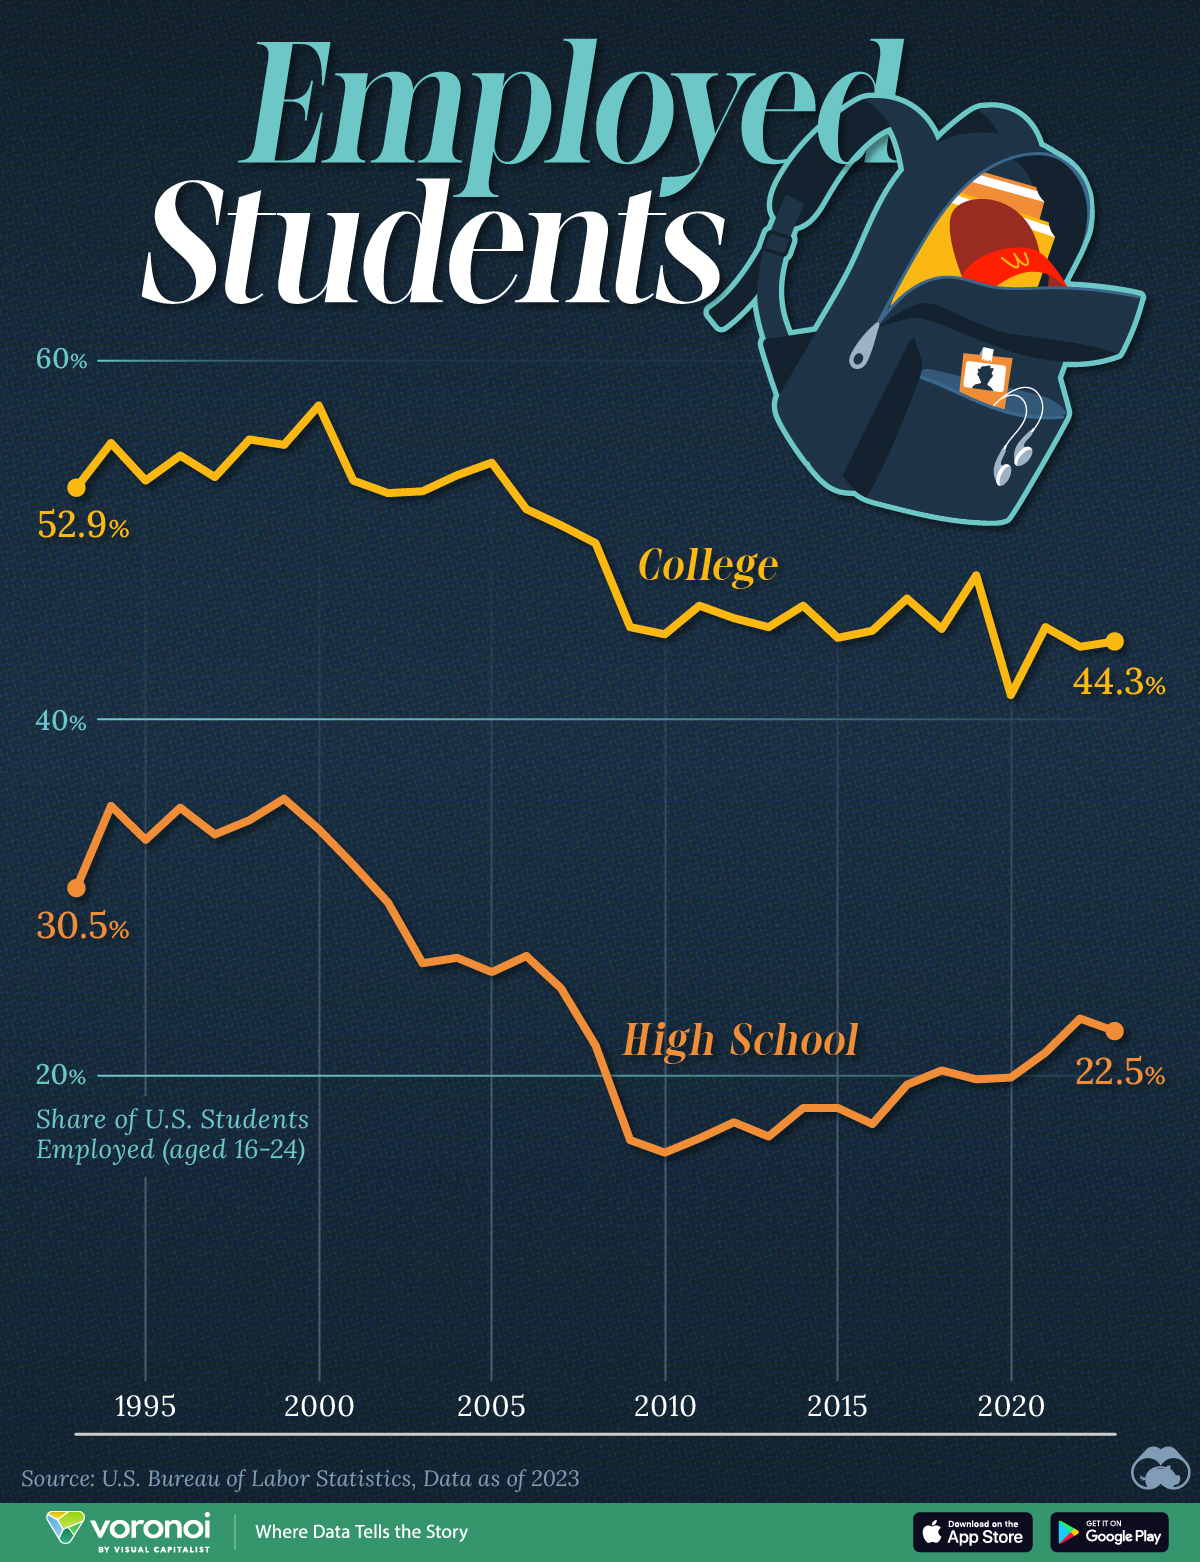
U.S. High School and College Student Employment (1993–2023)
This was originally posted on our Voronoi app. Download the app for free on iOS or Android and discover incredible data-driven charts from a variety of trusted sources.
As the new school year kicks off, the topic of student employment is on the minds of millions of youths in America.
The employment-population ratio of U.S. high school and college students is measured by taking the percentage of enrolled students who are employed. Unlike the unemployment rate, it also considers those who have stopped actively seeking employment into the equation.
The U.S. Bureau of Labor Statistics has tracked the employment-population ratio of high school and college students since 1993, measuring it every October.
This graphic shows U.S. high school and college employment from 1993 to 2023, based on data from the U.S. Bureau of Labor Statistics.
Peaks and Lows
Although the employment ratios of high school and college students have decreased since the 1990s, the U.S. does well on youth unemployment compared to other nations.
The peak of employment for high school students was 35.5% in 1999, while college employment peaked a year later at 57.5%.
| Year | High School Employment (%) | College Employment (%) |
|---|---|---|
| 1993 | 30.5 | 52.9 |
| 1994 | 35.1 | 55.4 |
| 1995 | 33.2 | 53.3 |
| 1996 | 35.0 | 54.7 |
| 1997 | 33.5 | 53.5 |
| 1998 | 34.3 | 55.6 |
| 1999 | 35.5 | 55.3 |
| 2000 | 33.8 | 57.5 |
| 2001 | 31.8 | 53.3 |
| 2002 | 29.7 | 52.6 |
| 2003 | 26.3 | 52.7 |
| 2004 | 26.6 | 53.6 |
| 2005 | 25.8 | 54.3 |
| 2006 | 26.7 | 51.7 |
| 2007 | 24.9 | 50.8 |
| 2008 | 21.7 | 49.8 |
| 2009 | 16.4 | 45.1 |
| 2010 | 15.7 | 44.7 |
| 2011 | 16.5 | 46.3 |
| 2012 | 17.4 | 45.6 |
| 2013 | 16.6 | 45.1 |
| 2014 | 18.2 | 46.3 |
| 2015 | 18.2 | 44.5 |
| 2016 | 17.3 | 44.9 |
| 2017 | 19.5 | 46.7 |
| 2018 | 20.3 | 45.0 |
| 2019 | 19.8 | 48.0 |
| 2020 | 19.9 | 41.3 |
| 2021 | 21.3 | 45.1 |
| 2022 | 23.2 | 44.0 |
| 2023 | 22.5 | 44.3 |
The lowest employment point for high school students was 15.7% after the Great Recession in 2010, but it has steadily risen since.
College students experienced their lowest employment ratio during the COVID-19 pandemic in 2020, at 41.3%.
Recent Trends
In 2023, college employment increased slightly to 44.3% from 44.0% in 2022. However, high school employment decreased to 22.5% in 2023 from 23.2% in 2022.
While both high school and college employment levels have been down since the 1990s, their trends have been different since the Great Recession.
Since 2010, high school employment has increased by 6.8 percentage points, while college employment decreased by 0.4 percentage points.
Learn More on the Voronoi App
To learn more about youth unemployment from a regional perspective, check out this graphic that compares rates in regions of the world.
The post U.S. High School and College Student Employment Rates (1993–2023) appeared first on Visual Capitalist.