
Written By Chris Dickert
Graphics & Design
- Pernia Jamshed
Published May 18, 2023
•
Updated May 18, 2023
•
The following content is sponsored by Boxabl
Visualized: The Decline of Affordable Housing in the U.S.
Over 80% of U.S. residents have
chosen to live in an urban setting, as of 2023.
And with that number set to rise to nearly 90% by 2050, house prices are rising, with significant consequences to housing affordability.
This visualization, the second in the Reimagining Home Series from our sponsor Boxabl, takes a deep dive into the evolution of the housing market in the U.S.
Housing Affordability At Its Lowest Ebb in Decades
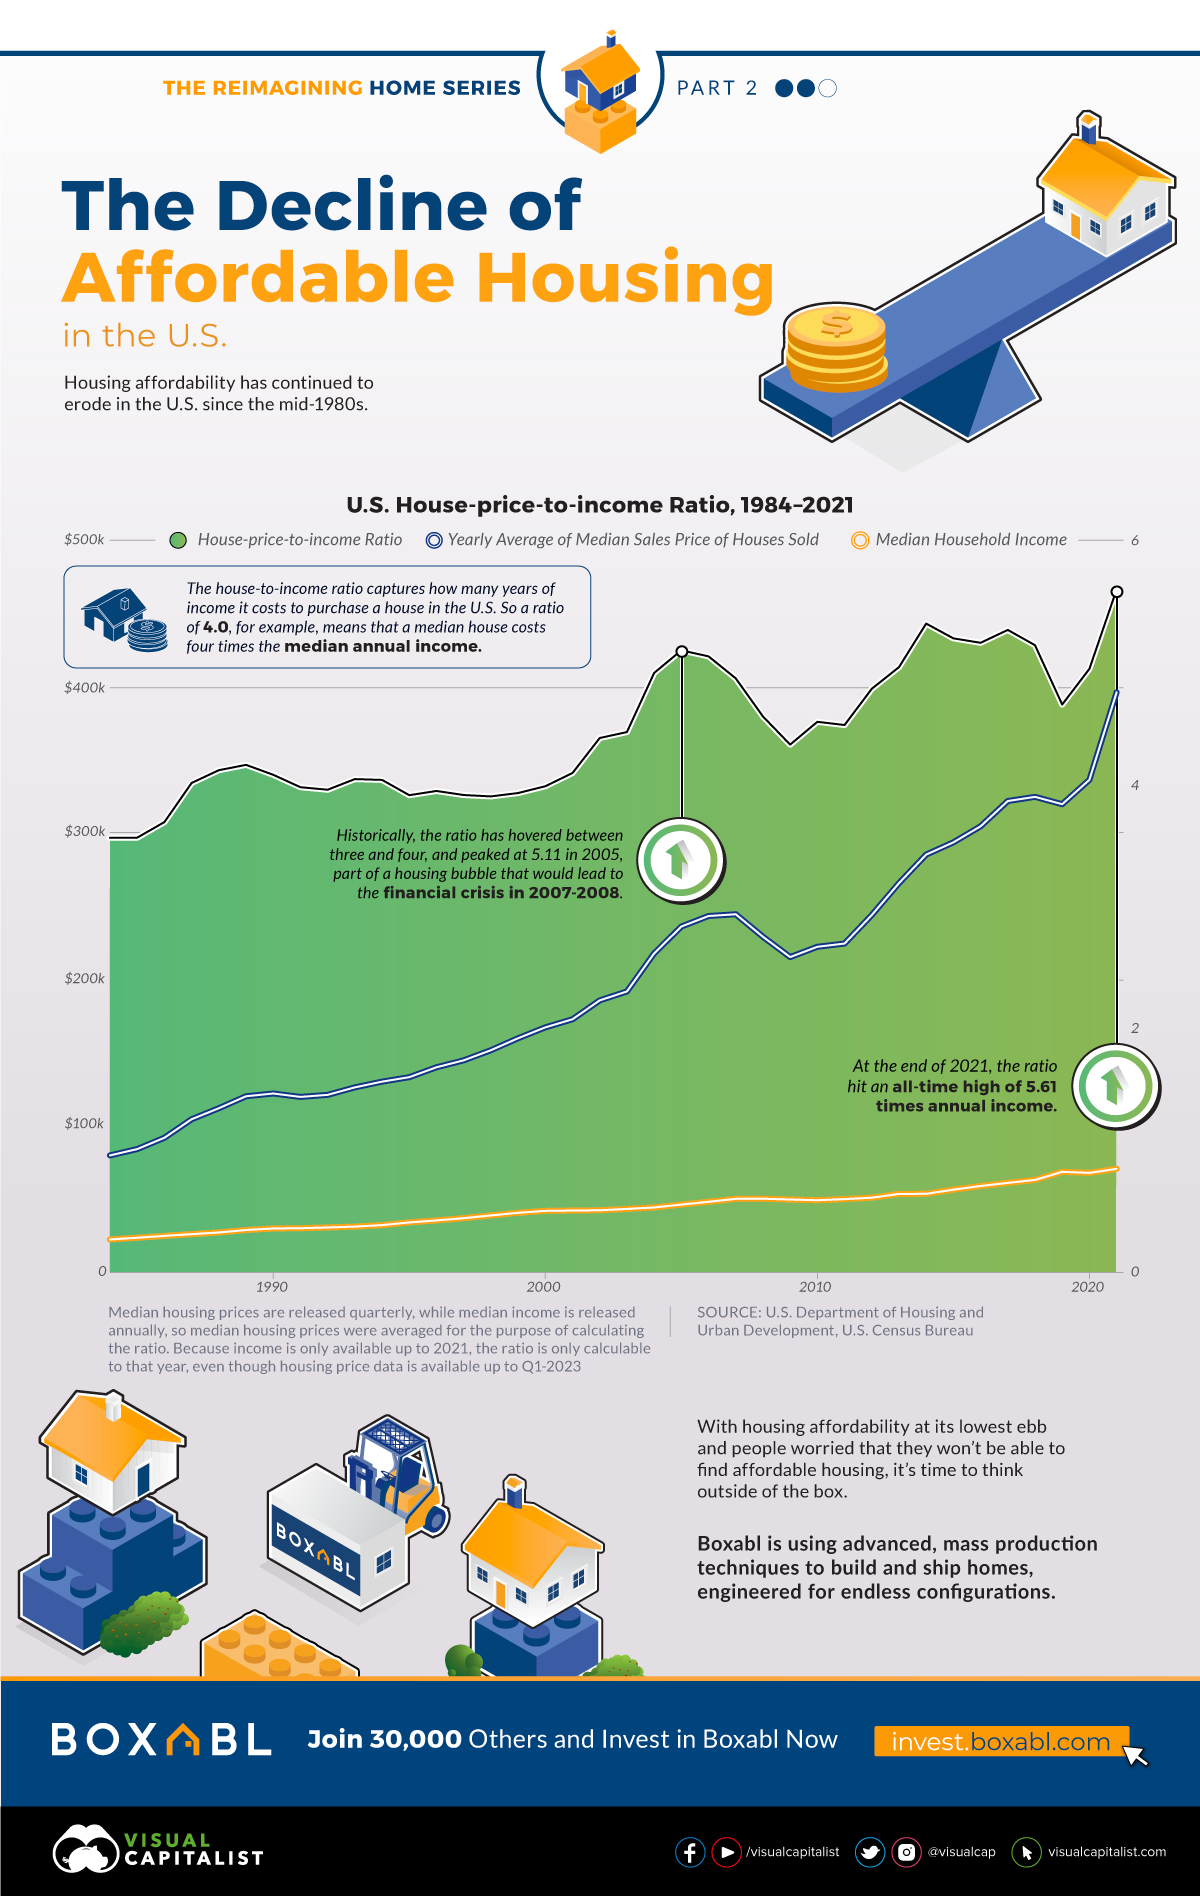
The U.S. house-price-to-income ratio, which tracks house prices in multiples of annual income, has steadily climbed since the mid-1980s, when the market was recovering from a real estate crash earlier that decade.
Historically, the ratio has hovered between three and four. But in the early aughts, the ratio passed four and kept going, reaching a high of 5.11 in 2005. The ratio fell somewhat in the aftermath of the subprime mortgage meltdown, but never returned to historical averages. New records were set in 2014 (5.33), and again in 2021 (5.61).
Note that because median housing prices and median household incomes are released at different frequencies, quarterly versus annually respectively, in order to calculate the ratio, housing prices were averaged on an annual basis.
| Year | Median House Price | Median Household Income | Ratio |
|---|---|---|---|
| 1984 | $79,950 | $22,415 | 3.57 |
| 1985 | $84,275 | $23,618 | 3.57 |
| 1986 | $92,025 | $24,897 | 3.70 |
| 1987 | $104,700 | $26,061 | 4.02 |
| 1988 | $112,225 | $27,225 | 4.12 |
| 1989 | $120,425 | $28,906 | 4.17 |
| 1990 | $122,300 | $29,943 | 4.08 |
| 1991 | $119,975 | $30,126 | 3.98 |
| 1992 | $121,375 | $30,636 | 3.96 |
| 1993 | $126,500 | $31,241 | 4.05 |
| 1994 | $130,425 | $32,264 | 4.04 |
| 1995 | $133,475 | $34,076 | 3.92 |
| 1996 | $140,250 | $35,492 | 3.95 |
| 1997 | $145,000 | $37,005 | 3.92 |
| 1998 | $151,925 | $38,885 | 3.91 |
| 1999 | $160,125 | $40,696 | 3.93 |
| 2000 | $167,550 | $41,990 | 3.99 |
| 2001 | $173,100 | $42,228 | 4.10 |
| 2002 | $186,025 | $42,409 | 4.39 |
| 2003 | $192,125 | $43,318 | 4.44 |
| 2004 | $218,150 | $44,334 | 4.92 |
| 2005 | $236,550 | $46,326 | 5.11 |
| 2006 | $243,750 | $48,201 | 5.06 |
| 2007 | $244,950 | $50,233 | 4.88 |
| 2008 | $229,550 | $50,303 | 4.56 |
| 2009 | $215,650 | $49,777 | 4.33 |
| 2010 | $222,700 | $49,276 | 4.52 |
| 2011 | $224,900 | $50,054 | 4.49 |
| 2012 | $244,400 | $51,017 | 4.79 |
| 2013 | $266,225 | $53,585 | 4.97 |
| 2014 | $285,775 | $53,657 | 5.33 |
| 2015 | $294,150 | $56,516 | 5.20 |
| 2016 | $305,125 | $59,039 | 5.17 |
| 2017 | $322,425 | $61,136 | 5.27 |
| 2018 | $325,275 | $63,179 | 5.15 |
| 2019 | $320,250 | $68,703 | 4.66 |
| 2020 | $336,950 | $68,010 | 4.95 |
| 2021 | $396,800 | $70,784 | 5.61 |
Housing data is available up to the first quarter of 2023, when median prices eased off from a record-high $479,500 at the end of 2022 to $436,800 in the first quarter of this year.
Because median household income is currently only available up to 2021, it’s not possible to calculate the ratio past that. However, unless there was an unusually large increase in income, the ratio has likely remained near record highs.
And throughout the seemingly unstoppable rise in house prices over the 38 years covered above, income has failed to keep up. Between 1984 and 2021, median incomes rose 3.16x from $22,415 to $70,784, while median housing prices increased nearly 5.26x to $423,600, up from $78,200.
Issue Top of Mind For Local Communities
Amid the steady erosion of housing affordability, U.S. residents have reacted with rising concern. In 2018, when the Pew Research Center asked about major problems affecting local communities, the top spot went to Drug Addiction at 42%, compared to 39% on the Availability of Affordable Housing.
In 2021, the situation reversed itself and housing affordability was the #1 problem according to 49% of respondents, an increase of 10%. Drug Addiction, on the other hand, fell to 35%.
In general, younger Americans (55%), urban residents (63%), and those with lower incomes (57%) expressed more concern than their counterparts.
Is There a Doctor in the House?
So what’s causing the erosion of housing affordability in the U.S.?
Ultimately, the U.S. is not building enough houses to keep pace with population growth. And you can see this in the housing start data. In January 1959, there were around 1.7 million housing starts, compared to January 2023, when there were 1.3 million. And this decrease happened despite the fact that the U.S. population nearly doubled, from 176 to 335 million.
Lots of different forces are working together at the local level to stop more houses from being built. Space is one reason. Local zoning laws that limit the construction of multi-family homes is another culprit. The COVID-19 pandemic has also caused global supply chain issues, leading to rising material costs for housing.
And the icing on the cake? Rising interest rates are making it even harder for first-time homebuyers to enter the market.
Thinking Outside of the Box on Housing
With housing affordability at its lowest ebb in over a decade and people worried that they won’t be able to find a place to live, it’s time to think outside of the box.
Boxabl uses advanced, mass production techniques to build and ship homes that significantly lower the cost of home ownership for everyone.
This is the second piece in the Reimagining Home Series. Part 1 takes a deep dive on urbanization in the U.S., while the third and final piece looks at how modular homes could be a solution to the U.S. affordability crisis.
Learn more about how Boxabl is helping tackle the housing affordability crisis.

Please enable JavaScript in your browser to complete this form.Subscribe to our free newsletter and get your mind blown on a daily basis: *Sign up
Related Topics: #united states #affordability #housing prices #housing markets #housing supply #Boxabl #modular housing
Click for Comments
var disqus_shortname = "visualcapitalist.disqus.com";
var disqus_title = "Visualized: The Decline of Affordable Housing in the U.S.";
var disqus_url = "https://www.visualcapitalist.com/sp/the-decline-of-affordable-housing-in-the-us/";
var disqus_identifier = "visualcapitalist.disqus.com-157488";
You may also like
-

Real Estate3 months ago
Visualized: The Most (and Least) Expensive Cities to Live In
From New York to Damascus, this infographic uses EIU cost of living data to rank the world’s most and least expensive cities to live in
-
Business7 months ago
These Global Cities Show the Highest Real Estate Bubble Risk
A global look at which cities have the most overheated real estate markets. Toronto shows the highest bubble risk in 2022.
-
United States10 months ago
Mapped: The Salary You Need to Buy a Home in 50 U.S. Cities
Is owning a home still realistic? This map lays out the salary you’d need to buy a home in 50 different U.S. metro areas.
-

Real Estate1 year ago
The World’s Largest Real Estate Investment Trusts (REITs)
Real estate investment trusts (REITS) are a simple alternative for investors looking to gain exposure to real estate.
-
Cities2 years ago
Pandemic Recovery: Have North American Downtowns Bounced Back?
All North American downtowns are facing a sluggish recovery, but some are still seeing more than 80% less foot traffic than pre-pandemic times
-
Cities2 years ago
The World’s Biggest Real Estate Bubbles in 2021
According to UBS, there are nine real estate markets that are in bubble territory with prices rising to unsustainable levels.
Subscribe
Please enable JavaScript in your browser to complete this form.Join the 380,000+ subscribers who receive our daily email *Sign Up
The post Visualized: The Decline of Affordable Housing in the U.S. appeared first on Visual Capitalist.

