Subscribe to the Advisor Channel free mailing list for more like this
Visualized: How Long Does it Take to Double Your Money?
This was originally posted on Advisor Channel. Sign up to the free mailing list to get beautiful visualizations on financial markets that help advisors and their clients.
At first glance, a 7% return on your investment may not seem that impressive. Yet what if you heard that your money could double in roughly 10 years?
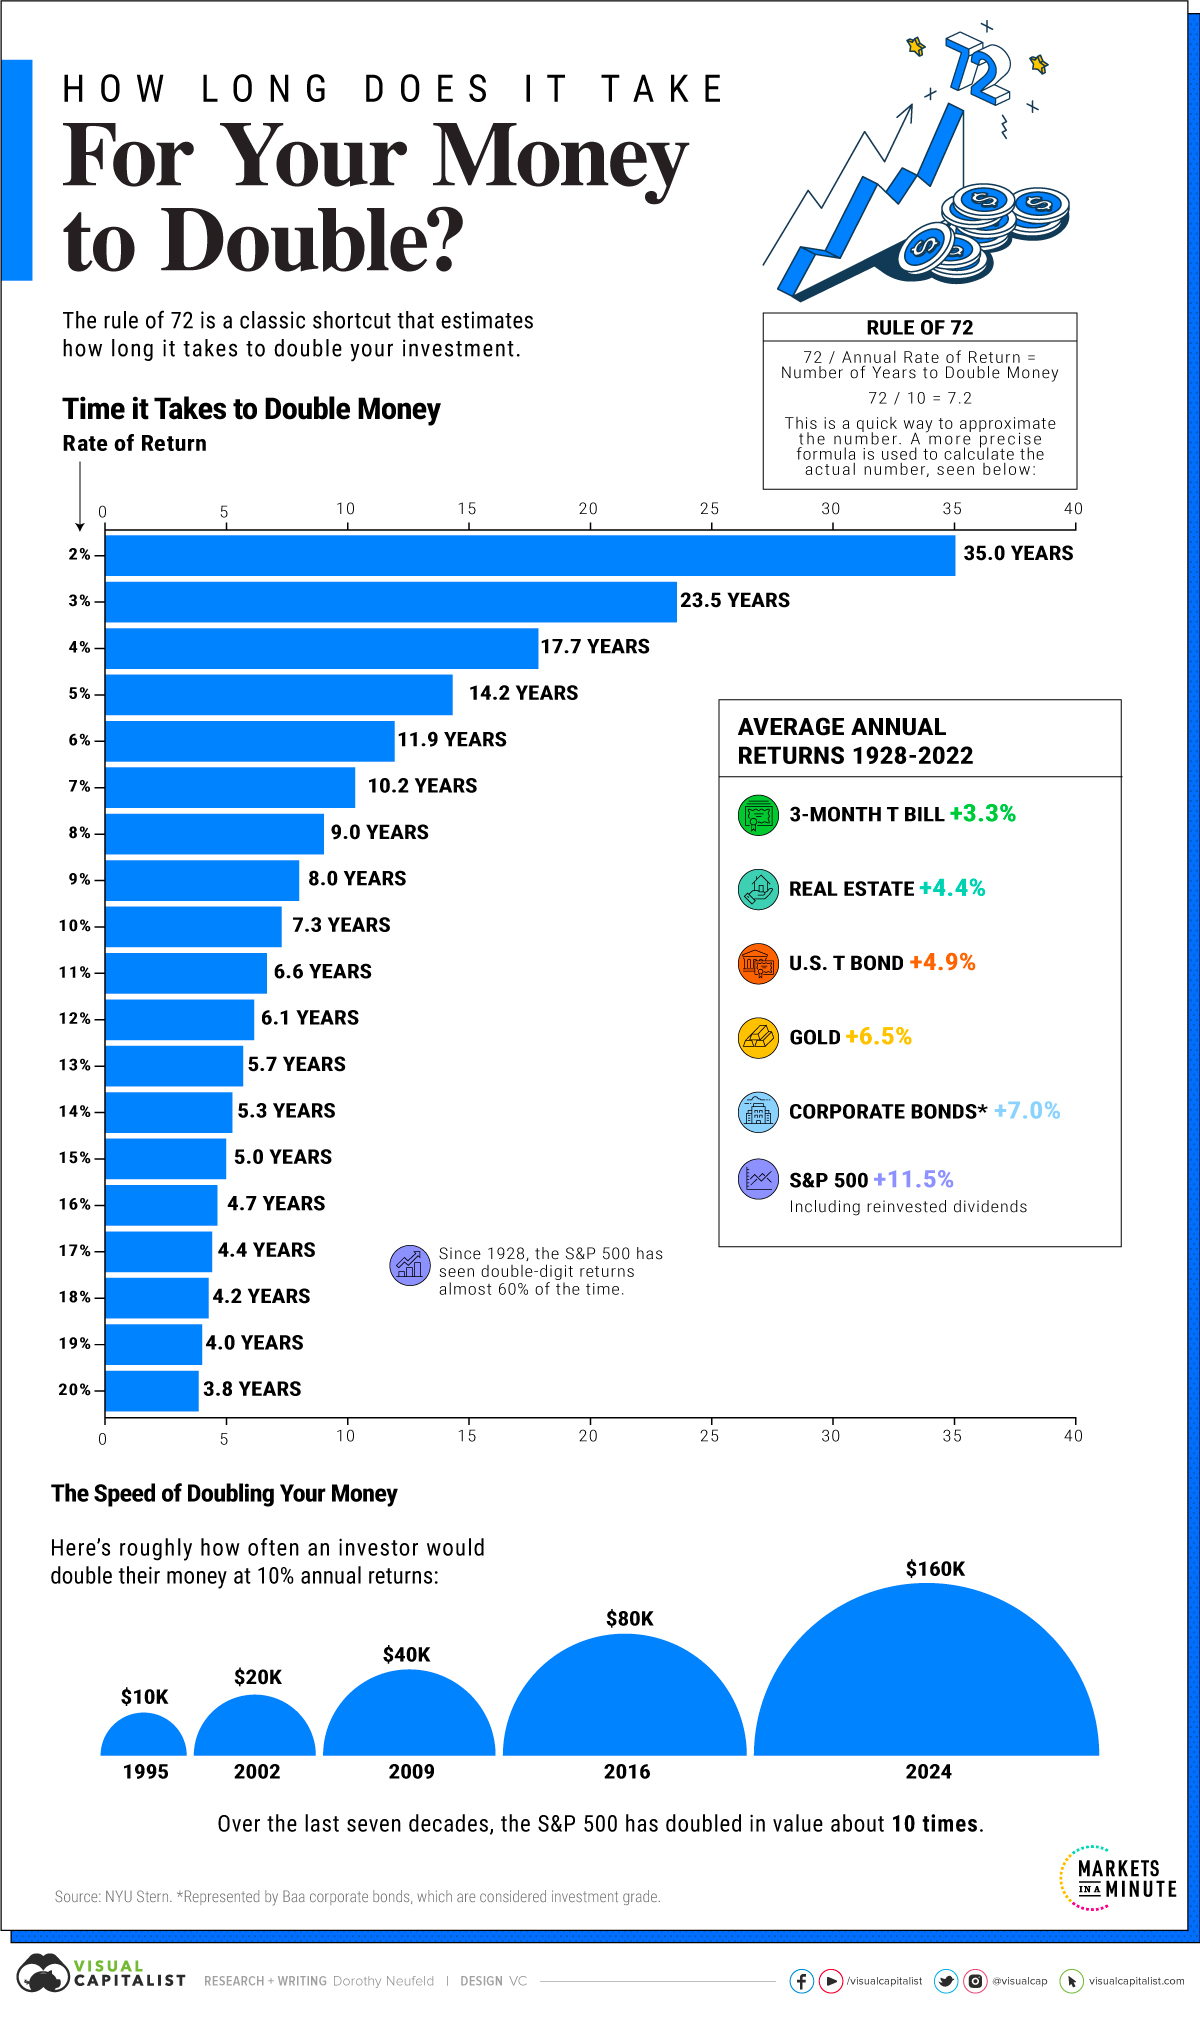
The above graphic takes the rule of 72 shortcut and uses the more precise logarithmic formula to show how long it takes to grow your money at different annualized returns.
Why it Pays to Know the Math
Using the classic rule of 72, an investor can estimate how long it takes to double their money. At 7% annual returns, an investor would see $10,000 grow to $20,000 in about a decade by taking 72 and dividing it by 7%, the rate of return.
While the rule of 72 serves as a guide to estimating when your money will double, the more accurate way to arrive at this number is through a logarithmic equation.
In short, it divides the natural log of 2 by the natural log of 1 and adds this to the rate of return. We can see in the table below how leads to different results from the rule of 72:
| Rate of Return | Rule of 72# of Years to Double Money | Logarithmic Formula# of Years to Double Money |
|---|---|---|
| 2% | 36.0 | 35.0 |
| 3% | 24.0 | 23.5 |
| 4% | 18.0 | 17.7 |
| 5% | 14.4 | 14.2 |
| 6% | 12.0 | 11.9 |
| 7% | 10.3 | 10.2 |
| 8% | 9.0 | 9.0 |
| 9% | 8.0 | 8.0 |
| 10% | 7.2 | 7.3 |
| 11% | 6.5 | 6.6 |
| 12% | 6.0 | 6.1 |
| 13% | 5.5 | 5.7 |
| 14% | 5.1 | 5.3 |
| 15% | 4.8 | 5.0 |
| 16% | 4.5 | 4.7 |
| 17% | 4.2 | 4.4 |
| 18% | 4.0 | 4.2 |
| 19% | 3.8 | 4.0 |
| 20% | 3.6 | 3.8 |
Consider if an investor put their money in the S&P 500. Historically, it has averaged 11.5% returns between 1928 and 2022. In 6.4 years, their money would double, assuming these average returns.
If they were to put this money in a savings account, where the average savings rate is 0.6%, it would take 120 more years for their money to reach this potential.
In real terms, which takes inflation into account, an investor would see their money lose value if they parked it in a savings account. Historically, inflation has averaged 3.3% over the last century.
Historical Asset Returns
Here’s how often different assets double, based on historical returns between 1928 and 2022:
| Date Range | Top Ranking Website | Highest Number of Monthly Visits |
|---|---|---|
| Jan 1993 - Jun 2000 | AOL | 405,000,000 |
| Jul 2000 - May 2006 | Yahoo | 5,500,000,000 |
| Jun 2006 - Jul 2008 | 8,300,000,000 | |
| Aug 2008 - Jun 2010 | Yahoo | 11,600,000,000 |
| Jul 2010 - current | 81,000,000,000 |
Source: NYU Stern. *Represents Baa corporate bonds, which are considered investment grade. **Includes reinvested dividends.
We can see that 3-month T-Bills, often considered among the safest assets, doubled about every 21 years. Often, investors consider this a place to put cash that is low-risk and highly liquid.
Interestingly, real estate assets had returns of 4.4%, doubling roughly every 16 years. Between 1928 and 2022, the value of $100 invested in real estate assets would be worth $5,121.52. By contrast, the value of $100 invested in the S&P 500, including reinvested dividends, would have reached over $624,000.
Data from NYU Stern shows that the S&P 500 has doubled about 10 times since 1949—through recessions and bull markets—illustrating the power of investing over the long run.
The post Visualized: How Long Does it Take to Double Your Money? appeared first on Visual Capitalist.