Published
25 mins ago
on
June 18, 2024
| 37 views
-->
By
Selin Oğuz
Article & Editing
- Ryan Bellefontaine
Graphics & Design
- Jennifer West
The following content is sponsored by National Public Utilities Council
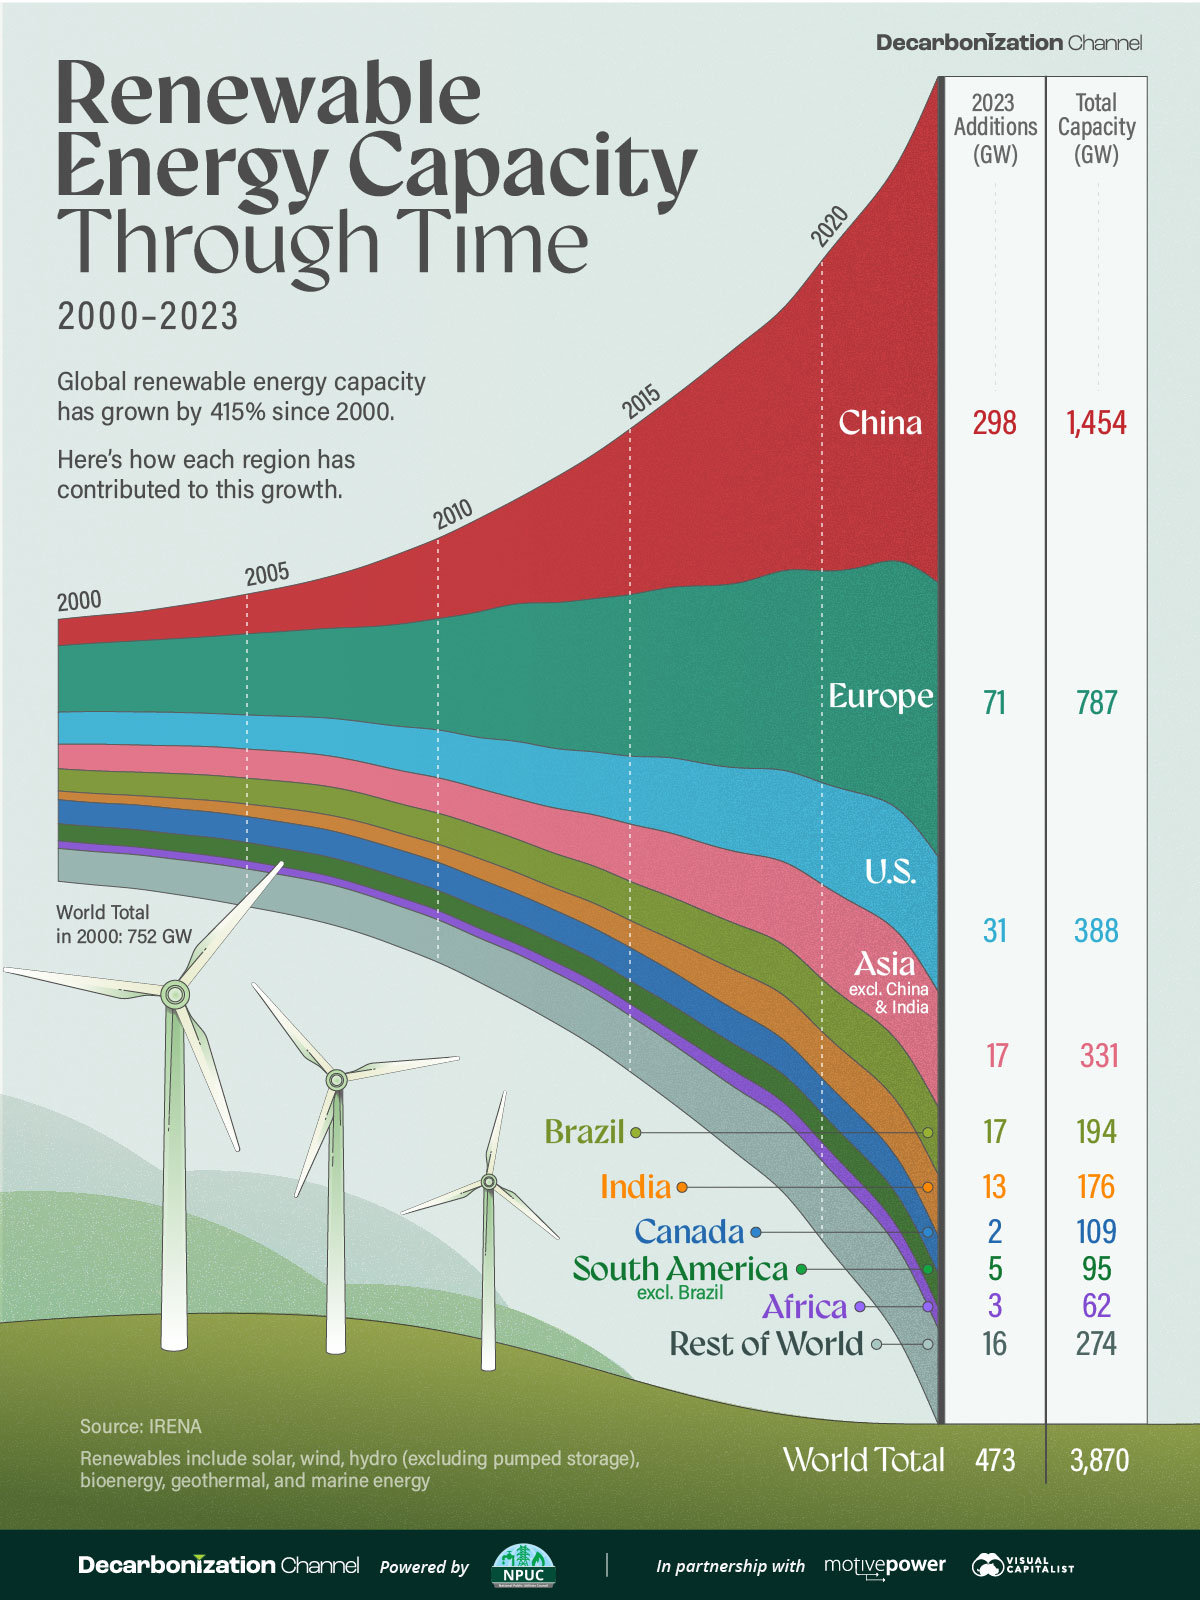
Visualized: Renewable Energy Capacity Through Time (2000–2023)
Global renewable energy capacity has grown by 415% since 2000, or at a compound annual growth rate (CAGR) of 7.4%.
However, many large and wealthy regions, including the United States and Europe, maintain lower average annual renewable capacity growth.
This chart, created in partnership with the National Public Utilities Council, shows how each world region has contributed to the growth in renewable energy capacity since 2000, using the latest data release from the International Renewable Energy Agency (IRENA).
Renewable Energy Trends in Developed Economies
Between 2000 and 2023, global renewable capacity increased from 0.8 to 3.9 TW. This was led by China, which added 1.4 TW, more than Africa, Europe, and North America combined. Renewable energy here includes solar, wind, hydro (excluding pumped storage), bioenergy, geothermal, and marine energy.
During this period, capacity growth in the U.S. has been slightly faster than what’s been seen in Europe, but much slower than in China. However, U.S. renewable growth is expected to accelerate due to the recent implementation of the Inflation Reduction Act.
Overall, Asia has shown the greatest regional growth, with China being the standout country in the continent.
| Region | 2000–2023 Growth | 10-Year Growth (2013–2023) | 1-Year Growth (2022–2023) |
|---|---|---|---|
| Europe | 313% | 88% | 10% |
| China | 1,817% | 304% | 26% |
| United States | 322% | 126% | 9% |
| Canada | 57% | 25% | 2% |
It’s worth noting that Canada has fared significantly worse than the rest of the developed world since 2000 when it comes to renewable capacity additions. Between 2000 and 2023, the country’s renewable capacity grew only by 57%.
Trends in Developing Economies
Africa’s renewable capacity has grown by 184% since 2000 with a CAGR of 4%.
India is now the most populous country on the planet, and its renewable capacity is also rapidly growing. From 2000–2023, it grew by 604%, or a CAGR of 8%.
It is worth remembering that energy capacity is not always equivalent to power generation. This is especially the case for intermittent sources of energy, such as solar and wind, which depend on natural phenomena.
Despite the widespread growth of renewable energy worldwide, IRENA emphasizes that global renewable generation capacity must triple from its 2023 levels by 2030 to meet the ambitious targets set by the Paris Agreement.

Please enable JavaScript in your browser to complete this form.Enjoying the data visualization above? *Subscribe
Related Topics: #renewable energy #wind #featured #NPUC #MotivePower #Renewable Energy Capacity
Click for Comments
var disqus_shortname = "visualcapitalist.disqus.com";
var disqus_title = "Visualized: Renewable Energy Capacity Through Time (2000–2023)";
var disqus_url = "https://www.visualcapitalist.com/sp/visualized-renewable-energy-capacity-through-time-2000-2023/";
var disqus_identifier = "visualcapitalist.disqus.com-167473";
You may also like
-

Stocks3 weeks ago
Comparing Saudi Aramco’s $1.9T Valuation to Its Rivals
See how much larger Saudi Aramco’s market cap is compared to rivals like Chevron, ExxonMobil, and Shell.
-

Mining4 weeks ago
Ranked: The World’s Largest Lithium Producers in 2023
Three countries account for almost 90% of the lithium produced in the world.
-

Energy1 month ago
Who’s Building the Most Solar Energy?
China’s solar capacity triples USA, nearly doubles EU.
-

Energy2 months ago
Mapped: The Age of Energy Projects in Interconnection Queues, by State
This map shows how many energy projects are in interconnection queues by state and how long these projects have been queued up, on average.
-

Lithium2 months ago
Ranked: The Top 10 EV Battery Manufacturers in 2023
Asia dominates this ranking of the world’s largest EV battery manufacturers in 2023.
-

Uranium2 months ago
The World’s Biggest Nuclear Energy Producers
China has grown its nuclear capacity over the last decade, now ranking second on the list of top nuclear energy producers.
Subscribe
Please enable JavaScript in your browser to complete this form.Join the 375,000+ subscribers who receive our daily email *Sign Up
The post Visualized: Renewable Energy Capacity Through Time (2000–2023) appeared first on Visual Capitalist.