![]()
See more visualizations like this on the Voronoi app.
Use This Visualization
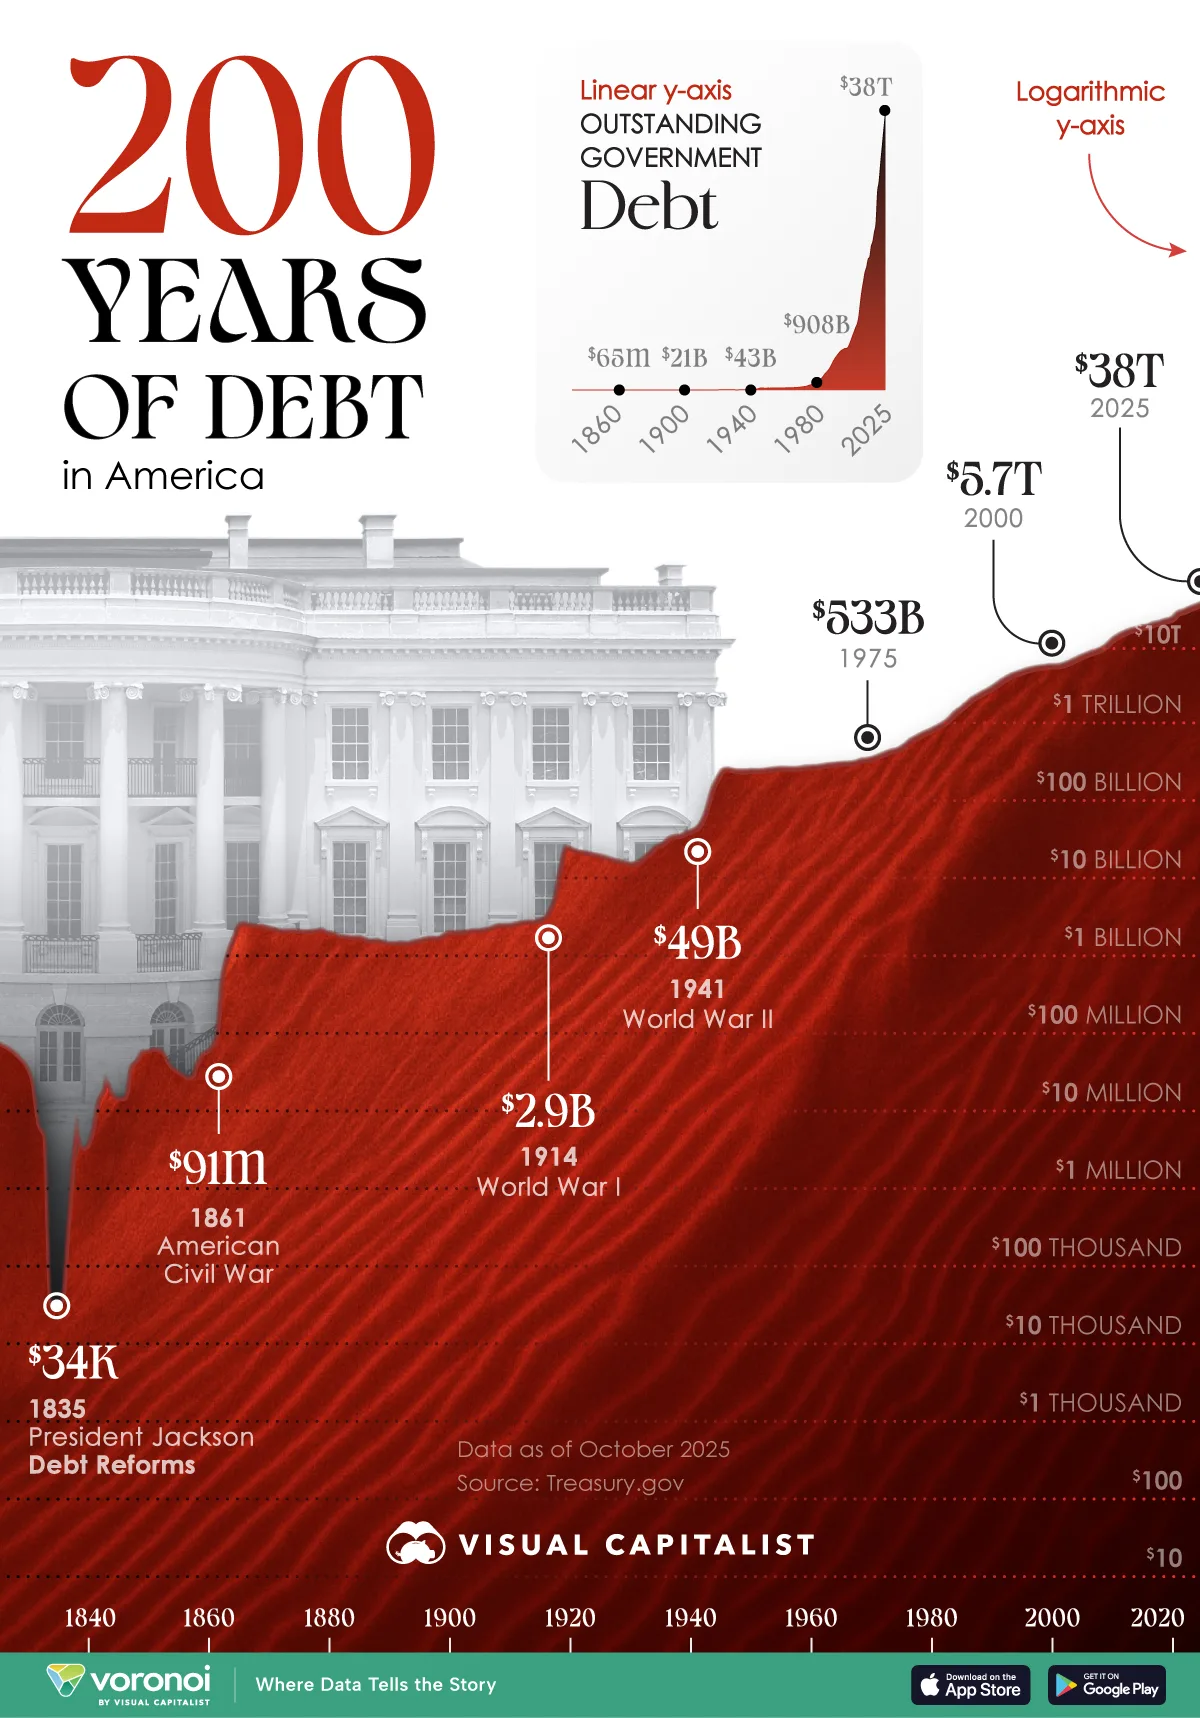
Visualizing the 200 Year History of U.S. Debt
See visuals like this from many other data creators on our Voronoi app. Download it for free on iOS or Android and discover incredible data-driven charts from a variety of trusted sources.
Key Takeaways
- The U.S. debt stands at $37.6 trillion, equal to 125% of GDP.
- Net interest payments on the debt are set to reach $1.3 trillion by 2030, and $1.8 trillion in 2035.
By 2035, net interest payments on U.S. debt are forecast to equal 22.2% of federal revenues.
As the U.S. debt pile hits $37.6 trillion, interest costs are forecast to reach $952 billion this year—nearly tripling in five years. In 10 years, they are set to hit a staggering $1.8 trillion, further squeezing the federal budget.
This graphic shows the U.S. debt since 1825, based on data from the U.S. Treasury.
A Brief History of U.S. Debt
Below, we show how America’s national debt burden has evolved over the last two centuries:
| Year | Outstanding U.S. Government Debt |
|---|---|
| 2025 | $37.6T |
| 2000 | $5.7T |
| 1975 | $533B |
| 1950 | $257B |
| 1925 | $20.5B |
| 1900 | $2.1B |
| 1875 | $2.2B |
| 1850 | $63.5M |
| 1825 | $83.8M |
As the above table shows, debt has swelled nearly sevenfold in 25 years.
Largely, this was driven by the Fed printing trillions of dollars in 2008 and the pandemic era. In 2020 alone, the Fed printed $3 trillion dollars under quantitative easing. Prior to these crises, this strategy was uncommon, but has since become a primary tool used by the central bank.
If we look back to mid-century America, we can see that debt expanded from $257 billion in 1950 to $533 billion 1975. Thanks to decades of strong economic growth, debt actually fell from 106% of GDP in 1946 to just 23% in 1974, a figure almost inconceivable to imagine today.
It’s also worth noting that U.S. debt was almost virtually eliminated at one point in America’s history. In 1835 under President Jackson, it fell to $34,000—down from $4.8 million in the previous year.
In particular, President Jackson relied on tariffs and the sale of public lands to raise revenue and reduce the national debt. However, these policies later helped trigger the Panic of 1837 amid a growing real estate bubble.
Learn More on the Voronoi App ![]()
To learn more about this topic, check out this graphic on debt-to-GDP in the European Union.