Subscribe to the Advisor Channel free mailing list for more like this
Visualizing Investor Sentiment Over 30 Years
This was originally posted on Advisor Channel. Sign up to the free mailing list to get beautiful visualizations on financial markets that help advisors and their clients.
Sometimes investor sentiment garners attention because it provides a glimpse at how investors might behave. In this way, sentiment would influence their investment behavior, and in turn the wider stock market.
To be sure, the link between sentiment and the stock market is not linear. In fact, many consider extreme sentiment readings as a contrarian indicator. If sentiment swings sharply in one direction, some investors may consider this a signal to do the reverse.
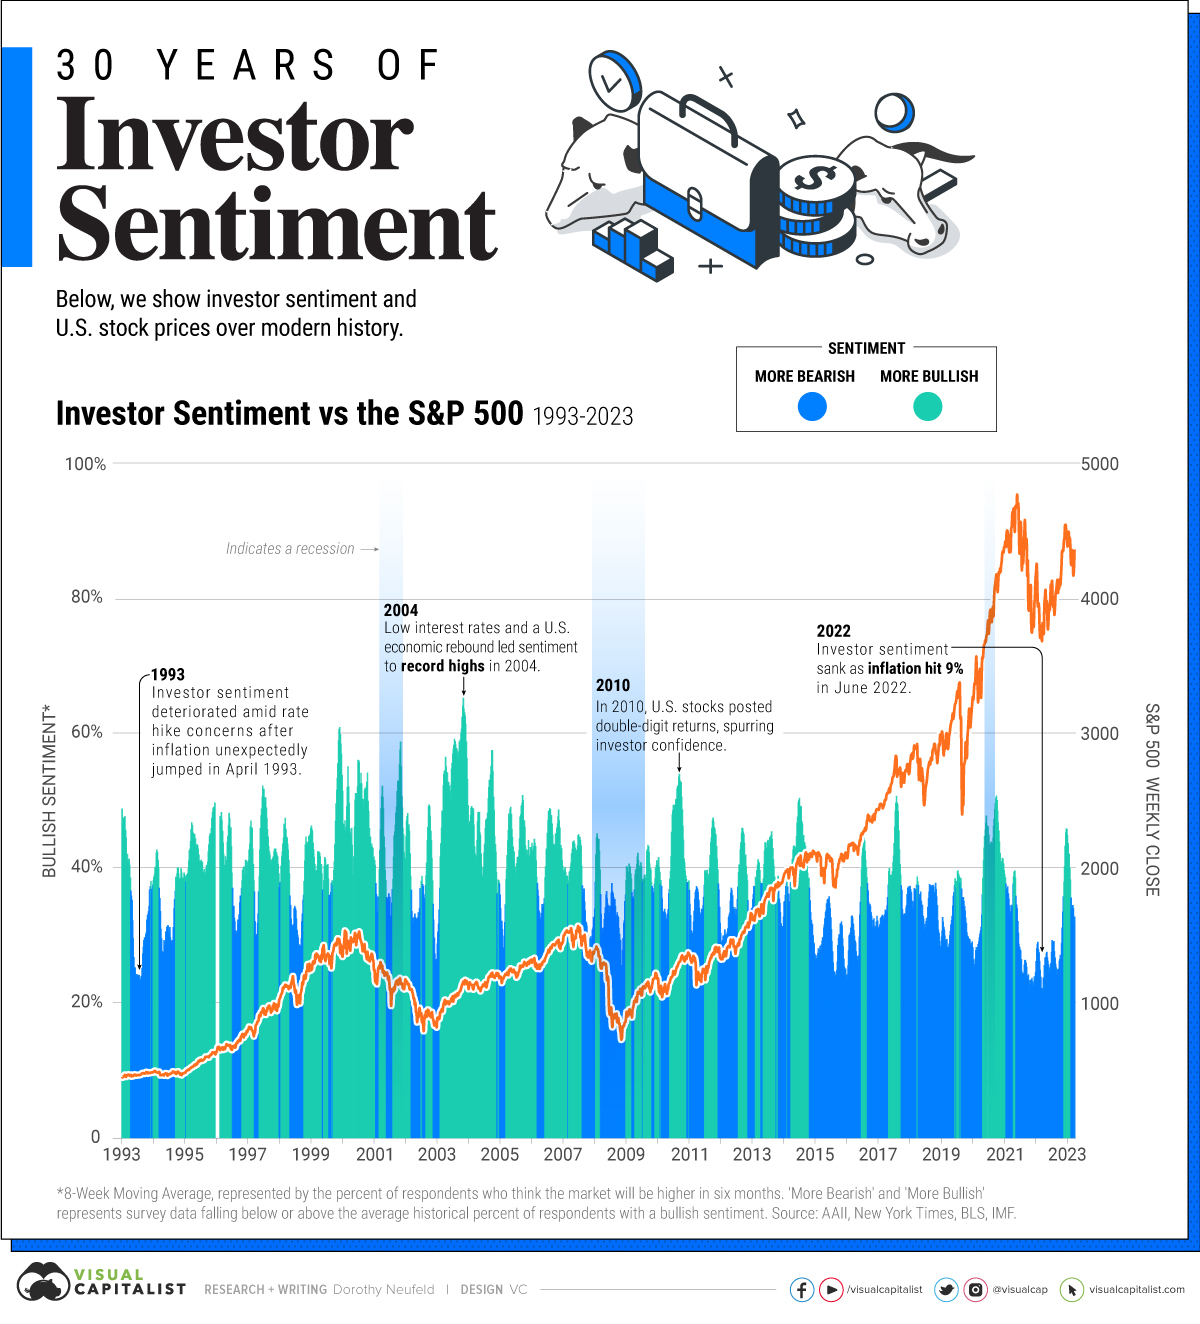
This graphic shows 30 years of investor sentiment, based on data from the American Association of Individual Investors (AAII).
How is Investor Sentiment Measured?
The AAII survey shows bullish sentiment, indicated by the percentage of investors who think the stock market will be higher in six months. We charted the eight-week moving average for bullish sentiment to smooth out fluctuations and show broader trends.
When Investor Optimism Ran High
When has sentiment peaked over historical market cycles?
The highest bullish readings took place during 2004 and 2000 surrounding the Dotcom bubble. In January 2004, the bullish eight-week moving average hit records amid a U.S. economic rebound, spurred by low interest rates after stocks had tumbled for over two years.
Prior to this, at the height of the bubble in early 2000, investor optimism accelerated. This came after the Nasdaq posted 86% returns in 1999, as tech stocks soared. In 1999, 13 stocks in the index saw at least 1,000% returns. The tech-heavy Nasdaq index later hit a high in March 2000 before bursting, not fully recovering until 2015.
Investor sentiment later hit highs in January 2011, following surging stock market performance as the S&P 500 fully recovered losses from the 2008 crash in late 2010. This rebound would become the longest bull market in history.
More recently, bullish sentiment jumped in April 2021 as the Federal Reserve signaled that interest rates would stay near rock bottom. In April, the S&P 500 hit new highs, climbing over 80% from March 2020 lows.
Where Does Sentiment Stand Today?
This year, investor sentiment has improved compared to 2022, as investors hope that the Fed may wind down interest rate hikes.
Despite real U.S. GDP picking up 4.9% year-over-year in the third quarter, October’s inflation reading remained unchanged compared to the previous month, sitting at 3.2%. The S&P 500 has increased roughly 18% in 2023 to-date, as investor optimism improves.
Yet a separate survey shows that almost 70% of U.S. consumers think a recession is coming next year.
With the looming uncertainty on the direction of interest rates—given strong economic data potentially lifting inflation—investors and consumers appear to have mixed views on where the market is heading even as stocks look to be resilient so far.
The post Visualizing 30 Years of Investor Sentiment appeared first on Visual Capitalist.