![]()
See this visualization first on the Voronoi app.
Use This Visualization
Visualizing the Decline of Copper Usage in EVs
This was originally posted on our Voronoi app. Download the app for free on iOS or Android and discover incredible data-driven charts from a variety of trusted sources.
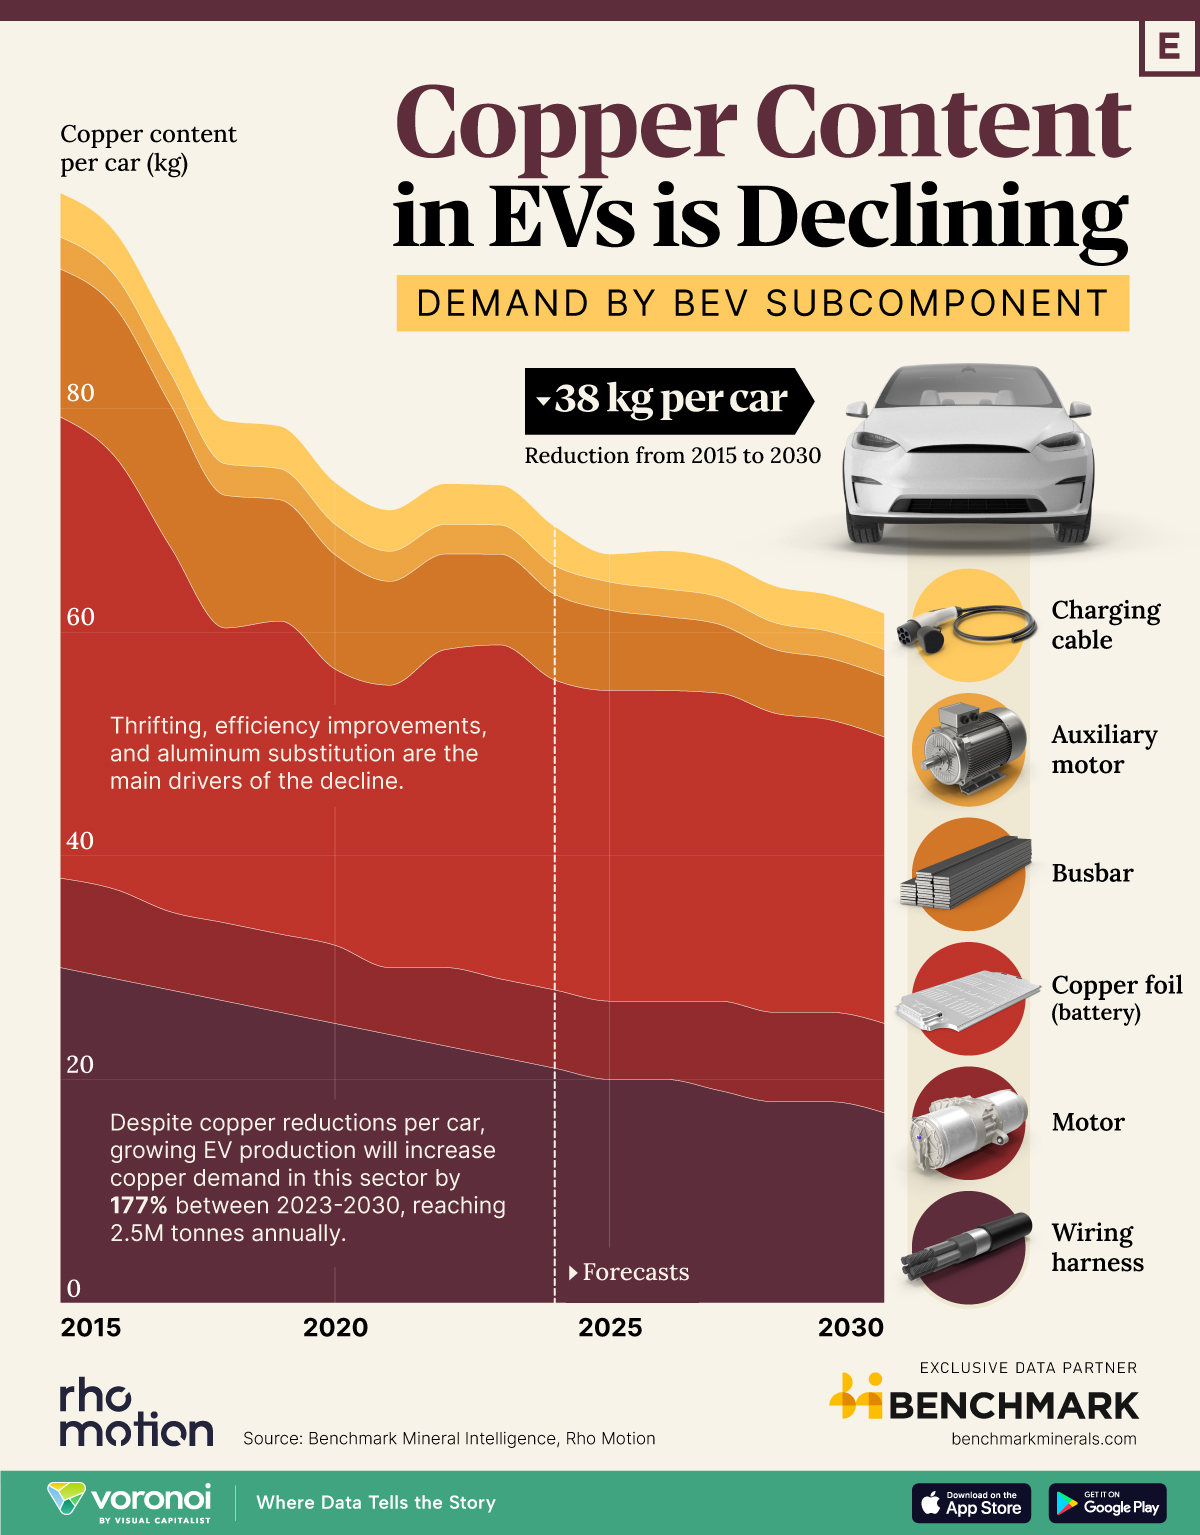
Copper intensity in passenger battery electric vehicles (BEVs) has steadily decreased over the last decade, driven by numerous technological advancements alongside increasing usage of alternative materials such as aluminum.
In this graphic, we visualize the evolution of copper demand in various subcomponents of passenger battery electric vehicles (BEVs) from 2015 to 2030F, along with total global copper demand driven by EVs for the same period. This data comes exclusively from Benchmark Mineral Intelligence.
Copper Intensity Per Car
According to Benchmark Mineral Intelligence, the copper intensity per vehicle is expected to decline by almost 38 kg, from 99 kg in 2015 to 62 kg by 2030.
| Year | Wiring | Motor | Copper Foil | Busbar | Auxiliary Motor | Charging Cable | Total |
|---|---|---|---|---|---|---|---|
| 2015 | 30 | 8 | 41.26 | 13.23 | 2.87 | 3.96 | 99.32 |
| 2016 | 29 | 8 | 38.68 | 13.37 | 2.85 | 3.92 | 95.82 |
| 2017 | 28 | 7 | 32.67 | 12.72 | 2.84 | 3.90 | 87.13 |
| 2018 | 27 | 7 | 26.39 | 11.87 | 2.82 | 3.88 | 78.96 |
| 2019 | 26 | 7 | 28.00 | 10.85 | 2.78 | 3.82 | 78.45 |
| 2020 | 25 | 7 | 24.71 | 10.24 | 2.73 | 3.76 | 73.44 |
| 2021 | 24 | 6 | 25.27 | 9.29 | 2.69 | 3.70 | 70.95 |
| 2022 | 23 | 7 | 28.44 | 8.56 | 2.65 | 3.64 | 73.29 |
| 2023 | 22 | 7 | 29.87 | 8.12 | 2.61 | 3.58 | 73.18 |
| 2024 | 21 | 7 | 27.73 | 7.67 | 2.56 | 3.52 | 69.48 |
| 2025 | 20 | 7 | 27.79 | 7.19 | 2.52 | 2.51 | 67.01 |
| 2026 | 20 | 7 | 27.78 | 6.63 | 2.48 | 3.41 | 67.30 |
| 2027 | 19 | 8 | 27.55 | 6.15 | 2.44 | 3.35 | 66.49 |
| 2028 | 18 | 8 | 26.77 | 5.70 | 2.40 | 3.30 | 64.17 |
| 2029 | 18 | 8 | 26.17 | 5.51 | 2.39 | 3.28 | 63.35 |
| 2030 | 17 | 8 | 25.63 | 5.44 | 2.37 | 3.26 | 61.70 |
One of the most significant factors driving this decline is thrifting, where engineers and manufacturers continuously improve the efficiency and performance of various components, leading to reduced copper usage. A key example of this is in battery production, where the thickness of copper foil used in battery anodes has significantly decreased.
In 2015, Benchmark estimated copper foil usage was just over 41 kg per vehicle (at an average thickness of 10 microns), but by 2030, it is projected to fall to 26 kg as manufacturers continue to adopt thinner foils.
Similarly, automotive wiring systems have become more localized, with advances in high-voltage wiring and modular integration allowing for reduced copper content in wiring harnesses.
Copper used in wiring has dropped from 30 kg per vehicle in 2015 to a projected 17 kg by 2030.
Newer, more compact power electronics and improved thermal management in motors and charging cables have also contributed to the reduction in copper usage.
Substitution has also played a role, with alternatives such as aluminum increasingly being used in components like busbars, wiring harnesses, and charging cable applications.
Aluminum’s lighter weight and lower cost have made it a practical alternative to copper in specific applications, though the additional space required to achieve the same level of conductivity can limit its use in certain cases.
Benchmark estimates that copper used in automotive wire harnesses has declined by 30% between 2015 and 2024.
The Road Ahead
Despite reductions in per-vehicle copper usage, the outlook for copper demand from the EV sector remains strong due to the sector’s growth.
| Year | EV Sector Copper Demand (tonnes) |
|---|---|
| 2015 | 56K |
| 2016 | 82K |
| 2017 | 111K |
| 2018 | 166K |
| 2019 | 179K |
| 2020 | 237K |
| 2021 | 447K |
| 2022 | 696K |
| 2023 | 902K |
| 2024F | 1.0M |
| 2025F | 1.2M |
| 2026F | 1.5M |
| 2027F | 1.7M |
| 2028F | 2.0M |
| 2029F | 2.2M |
| 2030F | 2.5M |
Benchmark’s analysis indicates that by 2030, copper demand driven by EVs alone will exceed 2.5 million tonnes, securing copper’s critical role in the transition to a low-carbon future.
Learn More About Copper From Visual Capitalist
If you enjoyed this post, be sure to check out this graphic that shows the growing control of Chinese companies over the copper market.
The post Visualizing the Decline of Copper Usage in EVs appeared first on Visual Capitalist.