
Published
29 seconds ago
on
February 3, 2026
| 6 views
-->
By
Jenna Ross
Article & Editing
- Ryan Bellefontaine
Graphics & Design
- Harrison Schell
The following content is sponsored by Terzo
Ranking CFO Compensation: The Top Earners
Key Takeaways
- Vaibhav Taneja at Tesla is the highest paid CFO, with total hourly compensation reaching nearly $49,000
- CFOs at the Magnificent Seven tech giants all hold a spot in the top 10 ranking.
Chief Financial Officers (CFOs) juggle high-stakes decisions daily, from financial strategy to risk management. Their compensation reflects this pressure, but how much are the top earners making per hour?
This graphic, in partnership with Terzo, highlights the highest paid CFOs in America. It’s part of our Markets in a Minute series, which features quick economic insights for executives.
What a CFO’s Hour is Worth
Based on the 50 largest companies in the U.S., we’ve compiled a ranking of the 10 highest paid CFOs. Their hourly earnings reflect total compensation including salary, bonuses, stocks, stock options, and other items like retirement contributions.
Here’s how it breaks down, based on a 55-hour workweek.
| Company | CFO Name | CFO Compensation Per Hour |
|---|---|---|
| Tesla | Vaibhav Taneja | $48,767 |
| Alphabet | Ruth Porat, Anat Ashkenazi | $13,462 |
| Microsoft | Amy E. Hood | $10,308 |
| Amazon | Brian T. Olsavsky | $8,992 |
| Cisco | R. Scott Herren | $8,494 |
| Meta | Susan Li | $8,259 |
| Netflix | Spencer Neumann | $8,008 |
| NVIDIA | Colette M. Kress | $7,469 |
| Goldman Sachs | Denis Coleman | $7,370 |
| Apple | Luca Maestri, Kevan Parekh | $7,225 |
Source: company SEC filings as of January 14, 2025. Based on the latest fiscal year. In cases where a CFO changed mid-year, total compensation was prorated accordingly.
Tesla’s Vaibhav Taneja earns the highest hourly compensation in the ranking, at nearly $49,000 per hour. This outsized figure stems largely from a one-time award of stocks and stock options totaling over $139 million, in recognition of Taneja’s promotion to CFO. About 80% was granted in stock options, making the value of Taneja’s earnings heavily tied to Tesla’s stock price.
Anat Ashkenazi, CFO at Alphabet and Google, takes the second spot. She was appointed CFO on July 31, 2024, so we’ve prorated her salary along with Ruth Porat, who previously served in the role. Ashkenazi’s negotiated compensation included nearly $39 million in stock awards and a one-time cash sign-on bonus of nearly $10 million.
Trends Among CFOs With the Highest Compensation
The two highest earners were new to their roles, highlighting the negotiating power executives have when accepting a promotion or moving to another company.
It’s also worth noting that nine of the top 10 highest earners are in the technology space, including all of the Magnificent Seven. Goldman Sachs’ CFO is the sole executive from the financial services space in the compensation ranking.
When your time is valuable, fast access to the right information is critical. NirvanAI is an all-in-one AI system that helps CFOs turn contracts into clear, actionable insights.
![]()
See NirvanAI in action and learn how it helps you make decisions with confidence.
More from Terzo
-

Markets3 weeks ago
Breaking Down America’s $13 Trillion ETF Market
This visualization breaks down the U.S. $13.4 trillion ETF market by asset class, showing how ETFs allocate capital across equities, bonds, and more.
-

Markets2 months ago
2025 in Review: The Ups, Downs, and Returns of Global Markets
Which country led stock markets in 2025? See the biggest shocks, rebounds, and year-end returns in this global recap.
-

Markets2 months ago
Mapped: The Biggest Housing Bubble Risks Globally
Which global cities are most at risk of a housing bubble? This new map ranks the world’s most overheated real estate markets.
-

Technology2 months ago
Ranked: The Top Factors That Build AI Trust
Want AI your team will trust? Pull back the curtain on the top factors that make people believe in artificial intelligence.
-

Technology2 months ago
Ranked: AI Hallucination Rates by Model
Find out how common AI hallucination is for leading models, and what that means for the businesses that rely on them.
-

Technology2 months ago
The Dangers of AI: Visualizing the Top Risks Companies Face
Among the dangers of AI, one stands apart as causing trouble for almost a third of companies. What do leaders need to know?
-

Business3 months ago
Ranked: Which Universities Build the Most Entrepreneurs?
Which university has had the most alumni become entrepreneurs in the last decade? Hint: its not Stanford or Harvard.
-

Economy3 months ago
Mapped: Where Workers Are Supporting the Most Seniors
In many advanced economies, the number of retirees is climbing while the working-age population shrinks. What are the countries where workers are supporting the most seniors?
-
Economy3 months ago
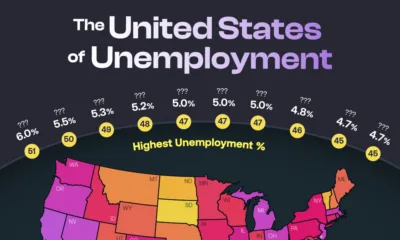
The United States of Unemployment
The national unemployment rate for the U.S. rose to 4.3% in August 2025. But that figure masks vast differences in local labor market health across states.
-

Markets3 months ago
Ranked: The Economies Most Dependent on International Trade
A trade war has threatened economic ties in 2025. Which economies are most exposed to these shifts in international trade?
-

Economy4 months ago
Top Countries Behind U.S. Tariff Revenue
Tariff rates vary by country, as does the value of goods each nation exports to the U.S. Which countries contribute the most?
-

Business4 months ago
Industries Hiring and Firing the Most Employees
As the U.S. labor market cools, which industries are still hiring—and which are cutting back their workforces?
-

Markets4 months ago
The $150T Global Debt Market
Global debt continues to climb, reaching $150T in Q1 2025. Which countries carry the heaviest burdens?
-
Money5 months ago
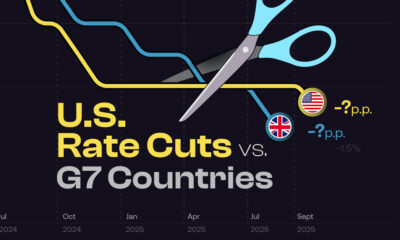
NEW: Fed Rate Cuts vs. Other G7 Countries
How do Fed rate cuts in the U.S. compare with the interest rate changes in other G7 countries, and what does it mean for business?
-
Jobs5 months ago
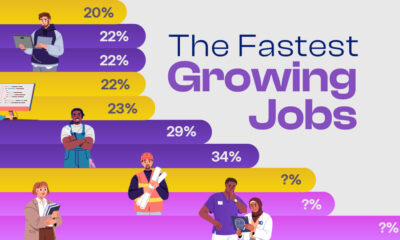
Ranked: The Fastest Growing Jobs (2024-2034)
Explore the fastest growing jobs by projected growth rate, plus salary insights, in a rapidly changing job market.
-

Investor Education5 months ago
The $127 Trillion Global Stock Market in One Giant Chart
This graphic pieces together the $127T global stock market to reveal which countries and regions dominate—and how much equity they control.
-

Personal Finance6 months ago
Late to the Ladder: The Rise in First-Time Home Buyers’ Age
The median age of first-time home buyers has reached a historic high. See just how long it’s taking people to get on the property ladder.
-

Markets6 months ago
Unpacking Real Estate Ownership by Generation (1991 vs. 2025)
The Silent Generation’s share of real estate has dropped dramatically as people age, but how have Baby Boomers, Gen X, and Millennials fared?
-
Business6 months ago
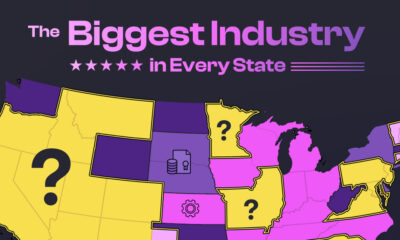
America’s Economic Engines: The Biggest Industry in Every State
Real estate is the biggest industry by GDP in 26 states. Find out why it dominates—and what fuels the rest of the country.
-
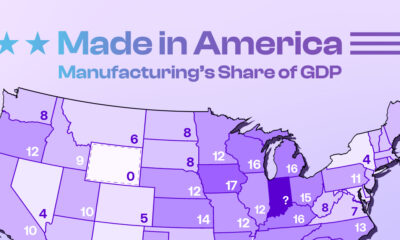
Maps7 months ago
Mapped: Manufacturing as a Share of GDP, by U.S. State
Tariffs are rising to boost American-made goods. Which states gain the most—and least—from manufacturing today?
-
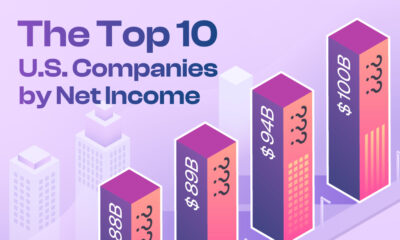
Technology7 months ago
Profit Powerhouses: Ranking The Top 10 U.S. Companies by Net Income
Collectively, the ten most profitable U.S. companies have a net income of $684 billion—more than the entire GDP of Belgium.
-

Money7 months ago
Millionaire Hubs: Mapping the World’s Wealthiest Cities
New York City has the highest millionaire population globally. Which other cities attract the world’s wealthiest?
-
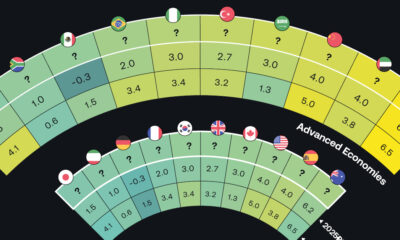
Economy8 months ago
Tomorrow’s Growth: GDP Projections in Key Economies
The global economy is expected to have slighter slower growth going forward. Which countries are on track to have the biggest GDP increases?
-
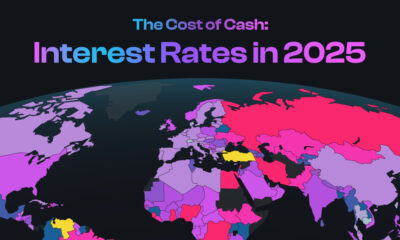
Money9 months ago
Mapped: Interest Rates by Country in 2025
The U.S. has kept their target rate the same at 4.25-4.50%. What do interest rates look like in other countries amid economic uncertainty?
-
Markets10 months ago
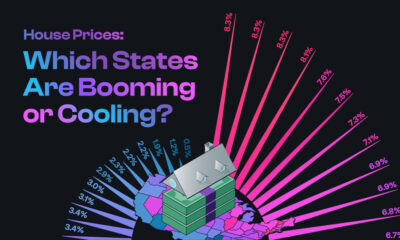
U.S. Housing Prices: Which States Are Booming or Cooling?
The national housing market saw a 4.5% rise in house prices. This graphic reveals which states had high price growth, and which didn’t.
-
Investor Education10 months ago
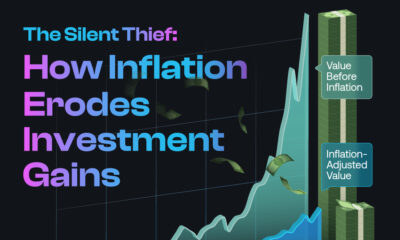
The Silent Thief: How Inflation Erodes Investment Gains
If you held a $1,000 investment from 1975-2024, this chart shows how the inflation rate can drastically reduce the value of your money.
-

Politics11 months ago
Trade Tug of War: America’s Largest Trade Deficits
Trump cites trade deficits—the U.S. importing more than it exports—as one reason for tariffs. Which countries represent the largest deficits?
Subscribe
Please enable JavaScript in your browser to complete this form.Join 375,000+ email subscribers: *Sign Up