Published
16 mins ago
on
September 27, 2023
| 25 views
-->
By
Dorothy Neufeld
Graphics & Design
- Alejandra Dander
The following content is sponsored by New York Life Investments
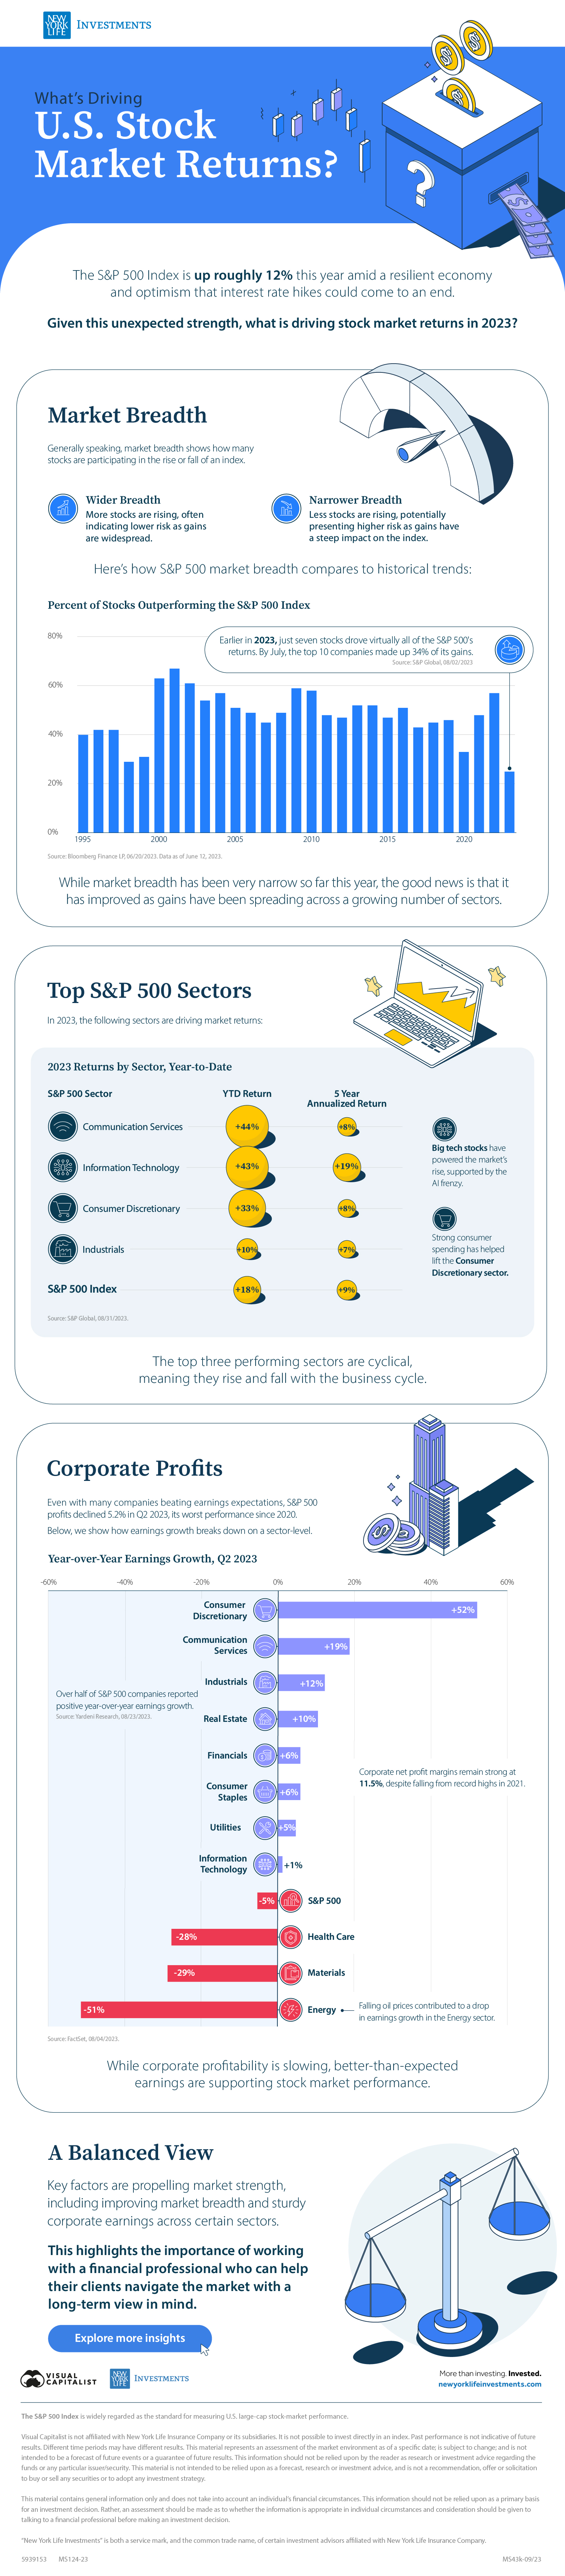
What’s Driving U.S. Stock Market Returns?
In many ways, U.S. stock market returns in 2023 have defied expectations. Strong U.S. economic activity, a robust labor market, and consumer spending have helped spur investor optimism. Year-to-date, the S&P 500 is up roughly 12%.
Given this unexpected strength, the above graphic, sponsored by New York Life Investments, explores key factors fueling stock market returns in 2023.
Market Breadth
Generally speaking, the concept of market breadth shows how many stocks are participating in the rise or fall of an index.
Wider Breadth: More stocks are rising, often indicating lower risk as gains are widespread.Narrower Breadth: Fewer stocks are rising, potentially presenting higher risk as gains have a steep impact on the index.
Earlier in 2023, just seven stocks drove virtually all of the S&P 500’s returns. By July, the top 10 companies made up 34% of its gains. Here’s how S&P 500 market breadth compares to historical trends:
| Year | Percent of Stocks Outperforming theS&P 500 Index |
|---|---|
| 2023* | 25% |
| 2022 | 57% |
| 2021 | 48% |
| 2020 | 33% |
| 2019 | 46% |
| 2018 | 45% |
| 2017 | 43% |
| 2016 | 51% |
| 2015 | 47% |
| 2014 | 52% |
| 2013 | 52% |
| 2012 | 47% |
| 2011 | 48% |
| 2010 | 58% |
| 2009 | 59% |
| 2008 | 49% |
| 2007 | 45% |
| 2006 | 49% |
| 2005 | 51% |
| 2004 | 57% |
| 2003 | 54% |
| 2002 | 61% |
| 2001 | 67% |
| 2000 | 63% |
| 1999 | 31% |
| 1998 | 29% |
| 1997 | 42% |
| 1996 | 42% |
| 1995 | 40% |
Source: Bloomberg Finance LP, 06/20/2023. *Data as of June 12, 2023.
While market breadth has been very narrow so far this year, the good news is that it has improved with gains spreading across a growing number of sectors.
Top S&P 500 Sectors
In 2023, the following sectors are driving market returns. Number have been rounded:
| S&P 500 Sector | YTD Return | 5-Year Annualized Return |
|---|---|---|
| Communication Services | +44% | +8% |
| Information Technology | +43% | +19% |
| Consumer Discretionary | +33% | +8% |
| Industrials | +10% | +7% |
| S&P 500 Index | +18% | +9% |
Source: S&P Global, 08/31/2023.
Big tech stocks have powered the market’s rise, supported by the AI frenzy. Additionally, strong consumer spending has helped lift the Consumer Discretionary sector.
Overall, we can see the top three performing sectors are cyclical, meaning they rise and fall with the business cycle.
Corporate Earnings
Even with many companies beating earnings expectations, year-over-year S&P 500 profits declined 5.2% in Q2 2023, its worst performance since 2020.
Below, we show how earnings growth breaks down by sector. Numbers have been rounded.
| S&P 500 Sector | Year-over-Year Earnings Growth Q2 2023 |
|---|---|
| Consumer Discretionary | +52% |
| Communication Services | +19% |
| Industrials | +12% |
| Real Estate | +10% |
| Financials | +6% |
| Consumer Staples | +6% |
| Utilities | +5% |
| Information Technology | +1% |
| Health Care | -28% |
| Materials | -29% |
| Energy | -51% |
| S&P 500 Index | -5% |
Source: FactSet, 08/04/2023.
As of Q2 2023, over half of S&P 500 companies reported positive year-over-year earnings growth. Furthermore, corporate net profit margins remain strong at 11.5%, despite falling from record highs in 2021.
While corporate profitability is slowing, better-than-expected earnings are supporting stock market performance.
Stock Market Returns: A Balanced View
Today, improving market breadth and sturdy corporate earnings across key sectors are supporting the market’s strength.
These factors, along with a solid macroeconomic backdrop, are leading to a brighter economic outlook in the coming year. As a result, investors see a higher likelihood of the economy achieving a soft landing.
In an ever-changing environment, it highlights the importance of working with a financial professional who can provide their clients with actionable and balanced strategies and help them stay on track as they navigate today’s market.
![]()
Explore more investment insights with New York Life Investments.

Please enable JavaScript in your browser to complete this form.Enjoying the data visualization above? *Subscribe
Related Topics: #s&p 500 #tech sector #New York Life Investments #market breadth #soft landing #corporate profits #top s&p 500 sectors
Click for Comments
var disqus_shortname = "visualcapitalist.disqus.com";
var disqus_title = "What’s Driving U.S. Stock Market Returns?";
var disqus_url = "https://www.visualcapitalist.com/sp/whats-driving-u-s-stock-market-returns/";
var disqus_identifier = "visualcapitalist.disqus.com-161253";
You may also like
-

Markets6 mins ago
The $109 Trillion Global Stock Market in One Chart
We show the entire global stock market in 2023, illustrating the dominance of U.S. markets. But as structural dynamics shift, will this last?
-
Markets2 days ago
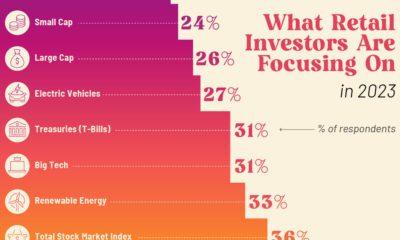
Charted: What are Retail Investors Interested in Buying in 2023?
What key themes and strategies are retail investors looking at for the rest of 2023? Preview: AI is a popular choice.
-

Wealth1 week ago
Mapped: The Migration of the World’s Millionaires in 2023
Where do the world’s wealthiest people want to live? This map tracks the migration of the world’s High Net Worth Individuals (HNWIs).
-
Markets1 week ago
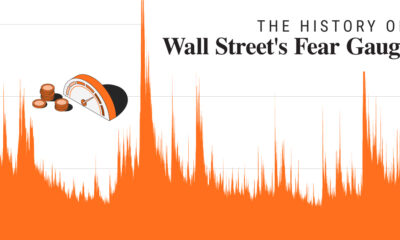
Charted: Market Volatility at its Lowest Point Since 2020
In 2023, market volatility has fallen dramatically. In this graphic, we show how it compares to historical trends.
-
Markets1 week ago
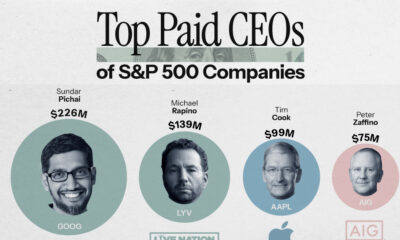
Ranked: The Highest Paid CEOs in the S&P 500
This graphic reveals the top 20 highest paid CEOs in the S&P 500 from Sundar Pichai to Jamie Dimon.
-

Markets2 weeks ago
The 25 Worst Stocks by Shareholder Wealth Losses (1926-2022)
Among publicly-listed U.S. companies, the 25 worst stocks have lost shareholders a collective $1.2 trillion since 1926.
Subscribe
Please enable JavaScript in your browser to complete this form.Join the 375,000+ subscribers who receive our daily email *Sign Up
The post What’s Driving U.S. Stock Market Returns? appeared first on Visual Capitalist.