![]()
See this visualization first on the Voronoi app.
Use This Visualization
Mapping Hurricane Risk on America’s Eastern Seaboard
This was originally posted on our Voronoi app. Download the app for free on iOS or Android and discover incredible data-driven charts from a variety of trusted sources.
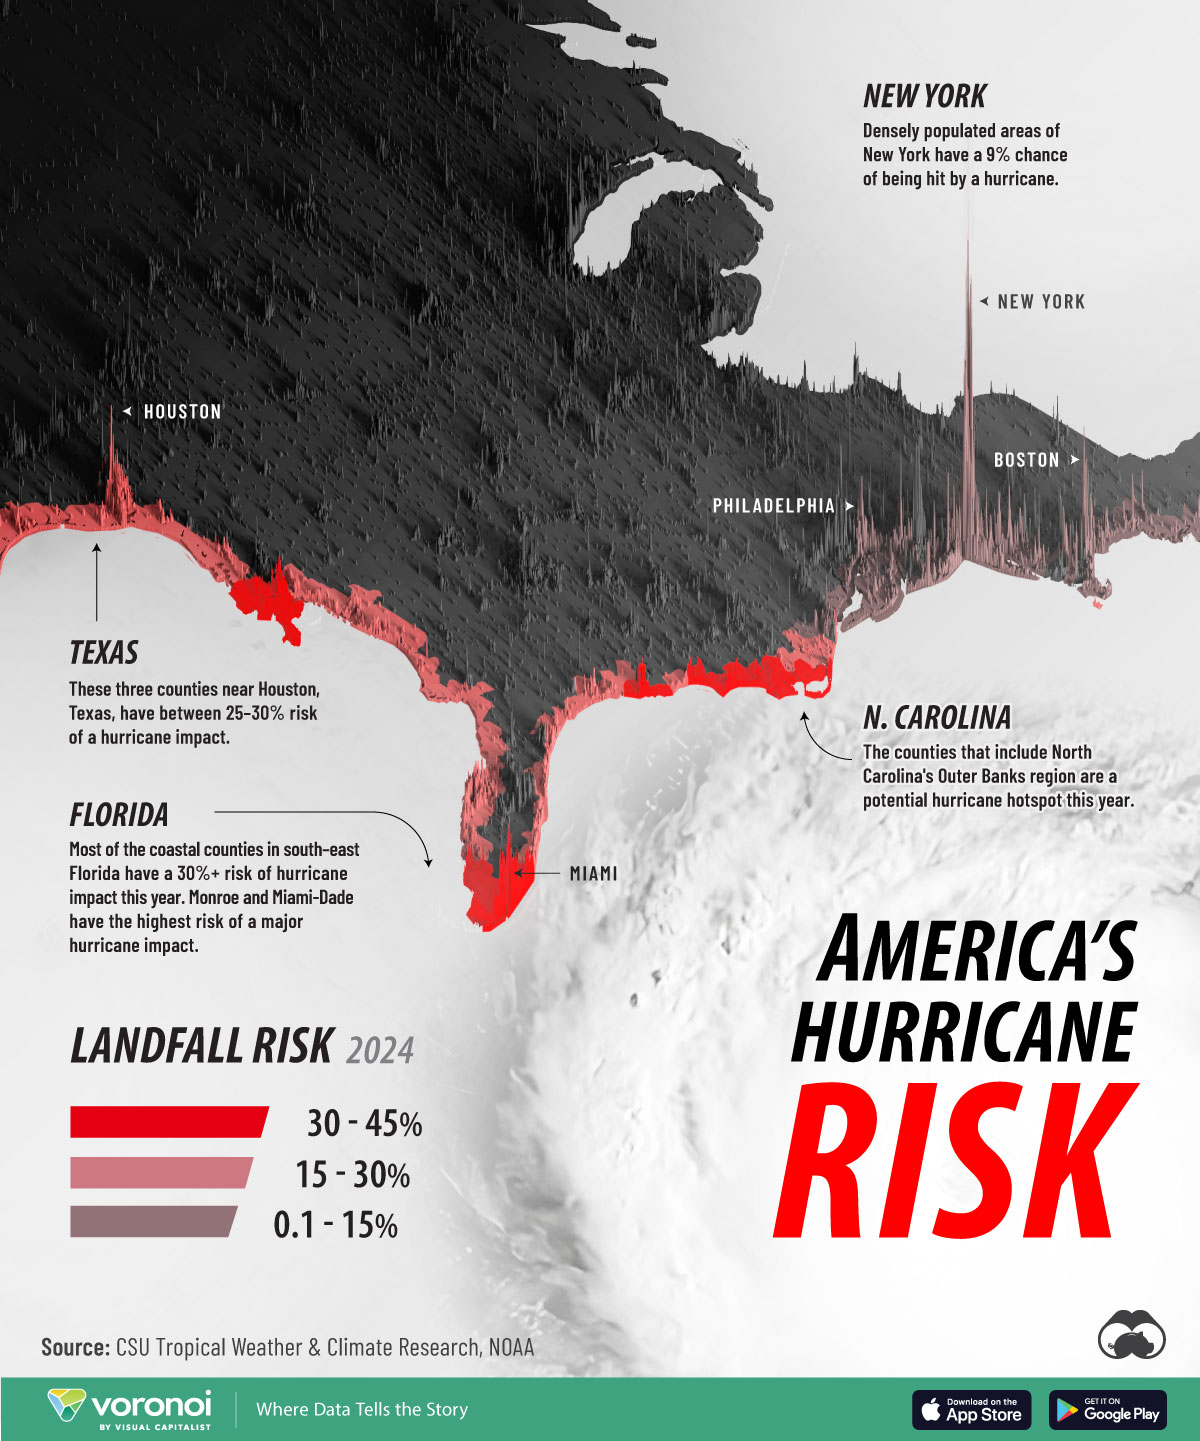
Hurricanes are a fact of life for people living along America’s Atlantic Coast. Of course, the risk of a hurricane making landfall varies depending where people live along that expansive coastline.
This infographic uses data from the Tropical Cyclone Impact Probabilities database at Colorado State University to show county-level risk (the red parts) of a hurricane impact, along with population centers along the coast (the spikes).
Potential Hurricane Hotspots
While a hurricane can make landfall anywhere along the coast, there are places where the probability of that happening is higher in 2024.
Below is the full list of counties and states, which includes other countries in North America as well, including Mexico (which, at the time of publishing, is being battered by Hurricane Beryl).
| State | County | Hurricanes (1880-2020) | Avg Probability of Hurricane Impact (2024) |
|---|---|---|---|
| Alabama | 46 | 43% | |
| Alabama | Baldwin | 28 | 29% |
| Alabama | Mobile | 28 | 29% |
| Connecticut | 11 | 13% | |
| Connecticut | Fairfield | 9 | 10% |
| Connecticut | Middlesex | 10 | 11% |
| Connecticut | New Haven | 11 | 13% |
| Connecticut | New London | 10 | 11% |
| Delaware | 9 | 10% | |
| Delaware | Kent | 4 | 5% |
| Delaware | New Castle | 1 | 1% |
| Delaware | Sussex | 9 | 10% |
| Florida | 115 | 75% | |
| Florida | Bay | 26 | 27% |
| Florida | Brevard | 26 | 27% |
| Florida | Broward | 36 | 35% |
| Florida | Charlotte | 26 | 27% |
| Florida | Citrus | 26 | 27% |
| Florida | Collier | 34 | 34% |
| Florida | Dixie | 19 | 21% |
| Florida | Duval | 22 | 23% |
| Florida | Escambia | 27 | 28% |
| Florida | Flagler | 22 | 23% |
| Florida | Franklin | 21 | 23% |
| Florida | Gulf | 23 | 24% |
| Florida | Hernando | 26 | 27% |
| Florida | Hillsborough | 27 | 28% |
| Florida | Indian River | 26 | 27% |
| Florida | Jefferson | 14 | 16% |
| Florida | Lee | 28 | 29% |
| Florida | Levy | 22 | 23% |
| Florida | Manatee | 28 | 29% |
| Florida | Martin | 27 | 28% |
| Florida | Miami-Dade | 37 | 36% |
| Florida | Monroe | 50 | 46% |
| Florida | Nassau | 20 | 22% |
| Florida | Okaloosa | 24 | 25% |
| Florida | Palm Beach | 34 | 34% |
| Florida | Pasco | 26 | 27% |
| Florida | Pinellas | 26 | 27% |
| Florida | Santa Rosa | 25 | 26% |
| Florida | Sarasota | 26 | 27% |
| Florida | St. Johns | 23 | 24% |
| Florida | St. Lucie | 23 | 24% |
| Florida | Taylor | 16 | 18% |
| Florida | Volusia | 26 | 27% |
| Florida | Wakulla | 18 | 20% |
| Florida | Walton | 26 | 27% |
| Georgia | 51 | 46% | |
| Georgia | Bryan | 21 | 23% |
| Georgia | Camden | 18 | 20% |
| Georgia | Chatham | 22 | 23% |
| Georgia | Glynn | 15 | 17% |
| Georgia | Liberty | 22 | 23% |
| Georgia | McIntosh | 21 | 23% |
| Louisiana | 68 | 56% | |
| Louisiana | Cameron | 23 | 24% |
| Louisiana | Iberia | 25 | 26% |
| Louisiana | Jefferson | 30 | 31% |
| Louisiana | Lafourche | 33 | 33% |
| Louisiana | Orleans | 23 | 24% |
| Louisiana | Plaquemines | 35 | 35% |
| Louisiana | St. Bernard | 33 | 33% |
| Louisiana | St. Mary | 27 | 28% |
| Louisiana | St. Tammany | 24 | 25% |
| Louisiana | Terrebonne | 34 | 34% |
| Louisiana | Vermilion | 24 | 25% |
| Maine | 10 | 11% | |
| Maine | Cumberland | 3 | 4% |
| Maine | Hancock | 6 | 7% |
| Maine | Knox | 6 | 7% |
| Maine | Lincoln | 3 | 4% |
| Maine | Sagadahoc | 3 | 4% |
| Maine | Waldo | 3 | 4% |
| Maine | Washington | 6 | 7% |
| Maine | York | 5 | 6% |
| Maryland | 16 | 18% | |
| Maryland | Anne Arundel | 1 | 1% |
| Maryland | Baltimore | 1 | 1% |
| Maryland | Baltimore City | 1 | 1% |
| Maryland | Calvert | 2 | 2% |
| Maryland | Cecil | 1 | 1% |
| Maryland | Dorchester | 5 | 6% |
| Maryland | Harford | 0 | 0% |
| Maryland | Kent | 0 | 0% |
| Maryland | Queen Anne's | 1 | 1% |
| Maryland | Somerset | 9 | 10% |
| Maryland | St. Mary's | 3 | 4% |
| Maryland | Talbot | 1 | 1% |
| Maryland | Wicomico | 6 | 7% |
| Maryland | Worcester | 13 | 15% |
| Massachusetts | 22 | 23% | |
| Massachusetts | Barnstable | 13 | 15% |
| Massachusetts | Dukes | 11 | 13% |
| Massachusetts | Essex | 7 | 8% |
| Massachusetts | Nantucket | 14 | 16% |
| Massachusetts | Norfolk | 7 | 8% |
| Massachusetts | Plymouth | 10 | 11% |
| Massachusetts | Suffolk | 7 | 8% |
| Mississippi | 47 | 43% | |
| Mississippi | Hancock | 22 | 23% |
| Mississippi | Harrison | 26 | 27% |
| Mississippi | Jackson | 24 | 25% |
| New Hampshire | 8 | 9% | |
| New Hampshire | Rockingham | 5 | 6% |
| New Jersey | 10 | 11% | |
| New Jersey | Atlantic | 10 | 11% |
| New Jersey | Burlington | 8 | 9% |
| New Jersey | Cape May | 10 | 11% |
| New Jersey | Essex | 4 | 5% |
| New Jersey | Hudson | 4 | 5% |
| New Jersey | Middlesex | 5 | 6% |
| New Jersey | Monmouth | 9 | 10% |
| New Jersey | Ocean | 10 | 11% |
| New Jersey | Salem | 2 | 2% |
| New Jersey | Union | 4 | 5% |
| New York | 14 | 16% | |
| New York | Bronx | 7 | 8% |
| New York | Kings | 6 | 7% |
| New York | Nassau | 8 | 9% |
| New York | New York | 9 | 10% |
| New York | Queens | 8 | 9% |
| New York | Richmond | 7 | 8% |
| New York | Suffolk | 12 | 14% |
| New York | Westchester | 7 | 8% |
| North Carolina | 68 | 56% | |
| North Carolina | Beaufort | 22 | 23% |
| North Carolina | Bertie | 15 | 17% |
| North Carolina | Brunswick | 32 | 32% |
| North Carolina | Camden | 20 | 22% |
| North Carolina | Carteret | 46 | 43% |
| North Carolina | Chowan | 17 | 19% |
| North Carolina | Craven | 31 | 31% |
| North Carolina | Currituck | 22 | 23% |
| North Carolina | Dare | 45 | 42% |
| North Carolina | Gates | 12 | 14% |
| North Carolina | Hertford | 11 | 13% |
| North Carolina | Hyde | 45 | 42% |
| North Carolina | New Hanover | 32 | 32% |
| North Carolina | Onslow | 35 | 35% |
| North Carolina | Pamlico | 31 | 31% |
| North Carolina | Pasquotank | 19 | 21% |
| North Carolina | Pender | 35 | 35% |
| North Carolina | Perquimans | 18 | 20% |
| North Carolina | Tyrrell | 26 | 27% |
| North Carolina | Washington | 19 | 21% |
| Rhode Island | 11 | 13% | |
| Rhode Island | Bristol | 8 | 9% |
| Rhode Island | Kent | 8 | 9% |
| Rhode Island | Newport | 10 | 11% |
| Rhode Island | Providence | 9 | 10% |
| Rhode Island | Washington/South | 9 | 10% |
| South Carolina | 48 | 44% | |
| South Carolina | Beaufort | 22 | 23% |
| South Carolina | Charleston | 33 | 33% |
| South Carolina | Colleton | 26 | 27% |
| South Carolina | Georgetown | 27 | 28% |
| South Carolina | Horry | 32 | 32% |
| South Carolina | Jasper | 21 | 23% |
| Texas | 64 | 54% | |
| Texas | Aransas | 16 | 18% |
| Texas | Brazoria | 25 | 26% |
| Texas | Calhoun | 20 | 22% |
| Texas | Cameron | 20 | 22% |
| Texas | Chambers | 24 | 25% |
| Texas | Galveston | 29 | 30% |
| Texas | Harris | 24 | 25% |
| Texas | Jefferson | 25 | 26% |
| Texas | Kenedy | 21 | 23% |
| Texas | Kleberg | 19 | 21% |
| Texas | Matagorda | 27 | 28% |
| Texas | Nueces | 21 | 23% |
| Texas | Refugio | 14 | 16% |
| Texas | San Patricio | 17 | 19% |
| Texas | Willacy | 19 | 21% |
| Virginia | 31 | 31% | |
| Virginia | Accomack | 13 | 15% |
| Virginia | Gloucester | 7 | 8% |
| Virginia | Hampton | 12 | 14% |
| Virginia | Lancaster | 5 | 6% |
| Virginia | Mathews | 7 | 8% |
| Virginia | Middlesex | 5 | 6% |
| Virginia | Newport News | 8 | 9% |
| Virginia | Norfolk | 12 | 14% |
| Virginia | Northampton | 13 | 15% |
| Virginia | Northumberland | 5 | 6% |
| Virginia | Poquoson | 9 | 10% |
| Virginia | Portsmouth | 10 | 11% |
| Virginia | Suffolk | 11 | 13% |
| Virginia | Virginia Beach | 18 | 20% |
| Virginia | York | 9 | 10% |
| Canada | 48 | 44% | |
| New Brunswick | 11 | 13% | |
| Newfoundland and Labrador | 24 | 25% | |
| Nova Scotia | 44 | 41% | |
| Prince Edward Island | 9 | 10% | |
| Mexico | 83 | 64% | |
| Campeche | 33 | 33% | |
| Quintana Roo | 57 | 50% | |
| Tabasco | 8 | 9% | |
| Tamaulipas | 43 | 41% | |
| Veracruz | 32 | 32% | |
| Yucatan | 43 | 41% | |
| Anguilla | 28 | 29% | |
| Antigua and Barbuda | 23 | 24% | |
| Aruba | 7 | 8% | |
| Bahamas, The | 106 | 72% | |
| Barbados | 9 | 10% | |
| Belize | 30 | 31% | |
| Bermuda | 42 | 40% | |
| Bonaire | 5 | 6% | |
| Cabo Verde | 4 | 5% | |
| Cayman Islands | 37 | 36% | |
| Costa Rica | 3 | 4% | |
| Cuba | 102 | 71% | |
| Curacao | 6 | 7% | |
| Dominica | 21 | 23% | |
| Dominican Republic | 61 | 52% | |
| Grenada | 10 | 11% | |
| Guadeloupe | 28 | 29% | |
| Guatemala | 23 | 24% | |
| Haiti | 42 | 40% | |
| Honduras | 46 | 43% | |
| Jamaica | 36 | 35% | |
| Martinique | 17 | 19% | |
| Montserrat | 22 | 23% | |
| Nicaragua | 25 | 26% | |
| Panama | 1 | 1% | |
| Puerto Rico | 38 | 37% | |
| Saba | 23 | 24% | |
| Saint Kitts and Nevis | 32 | 32% | |
| Saint Lucia | 15 | 17% | |
| Saint Martin | 23 | 24% | |
| Saint Vincent and the Grenadines | 13 | 15% | |
| Sint Eustatius | 23 | 24% | |
| Sint Maarten | 23 | 24% | |
| Trinidad and Tobago | 3 | 4% | |
| Turks and Caicos | 32 | 32% | |
| UK Virgin Islands | 35 | 35% | |
| US Virgin Islands | 30 | 31% |
The counties that make up the southern tip of Florida have the highest risk of a major hurricane impact. Monroe County, which includes Key West, has a 46% chance of a hurricane impact, and a 27% chance of a major hurricane impact.
Another potential hurricane hotspot is the Outer Banks region of North Carolina. Three counties that include the Outer Banks find themselves in the top five ranking for hurricane impact risk. Unlike Florida though, the risk of a major hurricane impact is much lower.
The three counties along the coast near Houston, Texas, have between 25–30% risk of a hurricane impact. Galveston is no stranger to hurricane activity. The constant threat of storms making impact was one reason Houston—which is further inland—grew to be the much bigger city.
The post Mapped: Hurricane Risk on America’s Eastern Seaboard appeared first on Visual Capitalist.