![]()
See this visualization first on the Voronoi app.

Use This Visualization
Mapped: High School Graduation Rates by State
This was originally posted on our Voronoi app. Download the app for free on iOS or Android and discover incredible data-driven charts from a variety of trusted sources.
A high school diploma not only represents the development of essential knowledge and skills but is also a critical step toward personal and professional growth.
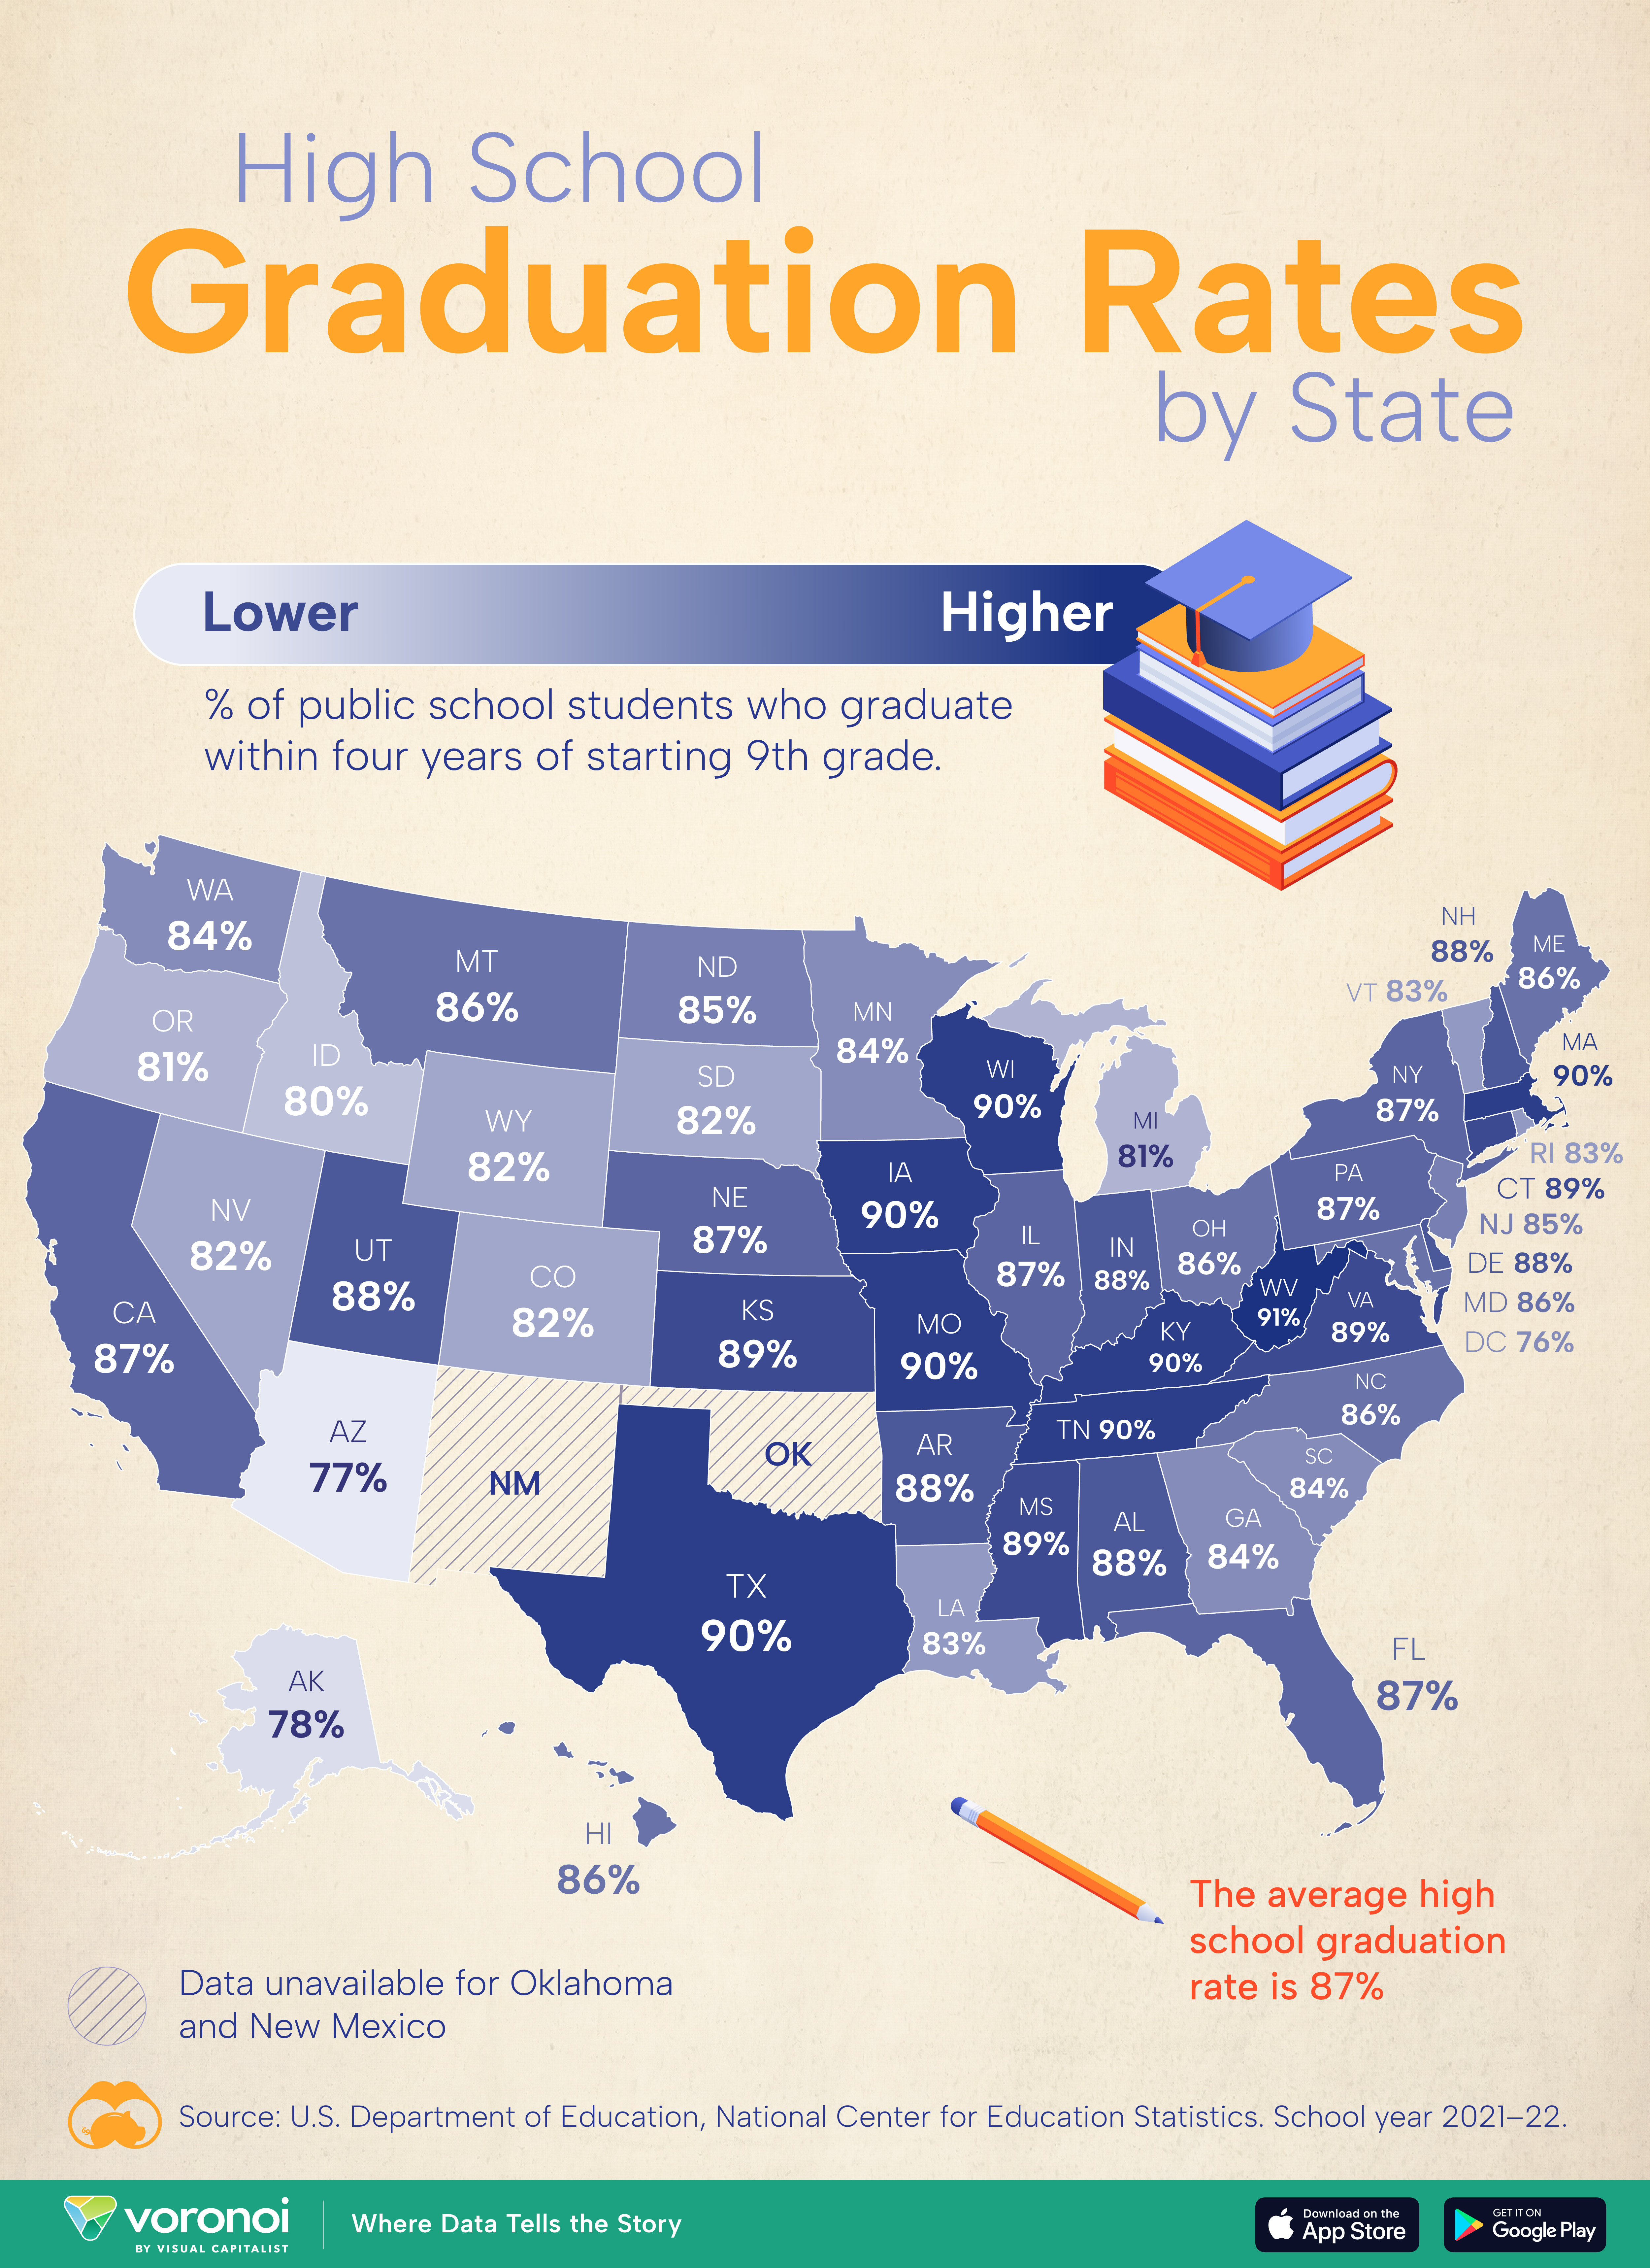
This graphic shows the percentage of public school students who graduate with a regular high school diploma in each U.S. state. Data is sourced from the U.S. Department of Education, National Center for Education Statistics, for the school year 2021–22.
West Virginia Has the Highest Graduation Rate
The U.S. average high school graduation rate was 87% in the school year 2021–22.
West Virginia has the highest graduation rate, with 91% of its students graduating. Meanwhile, the District of Columbia has the lowest graduation rate, with 76%.
| State | Percentage |
|---|---|
| West Virginia | 91 |
| Tennessee | 90 |
| Wisconsin | 90 |
| Kentucky | 90 |
| Massachusetts | 90 |
| Iowa | 90 |
| Missouri | 90 |
| Texas | 90 |
| Virginia | 89 |
| Kansas | 89 |
| Connecticut | 89 |
| Mississippi | 89 |
| New Hampshire | 88 |
| Delaware | 88 |
| Utah | 88 |
| Alabama | 88 |
| Arkansas | 88 |
| Indiana | 88 |
| Florida | 87 |
| Illinois | 87 |
| Pennsylvania | 87 |
| Nebraska | 87 |
| California | 87 |
| New York | 87 |
| North Carolina | 86 |
| Maryland | 86 |
| Ohio | 86 |
| Maine | 86 |
| Hawaii | 86 |
| Montana | 86 |
| New Jersey | 85 |
| North Dakota | 85 |
| Georgia | 84 |
| South Carolina | 84 |
| Minnesota | 84 |
| Washington | 84 |
| Rhode Island | 83 |
| Louisiana | 83 |
| Vermont | 83 |
| Colorado | 82 |
| Wyoming | 82 |
| Nevada | 82 |
| Oregon | 81 |
| Michigan | 81 |
| Idaho | 80 |
| Alaska | 78 |
| Arizona | 77 |
| District of Columbia | 76 |
| New Mexico | Not available |
| Oklahoma | Not available |
Given that West Virginia typically struggles in rankings like this, this top placement might be surprising to some. This high graduation rate is part of a concerted effort by the state to increase its graduation rate.
In 2011, West Virginia’s graduation rate sat at 72% (which would put them dead last by today’s standards). How did the state see such a significant improvement? A data-driven early warning system was put in place to target individuals when they are at most risk of dropping out and using interventions to keep them on pace to graduate.
Alabama, also an early adopter of this system, saw a steep improvement in their graduation rate over the past decade and a half.
If you enjoy posts like these, check out Mapped: Personal Finance Requirements by State, which visualizes where high school students are required to take a personal finance course.
The post Mapped: High School Graduation Rates by State appeared first on Visual Capitalist.