![]()
See this visualization first on the Voronoi app.

Use This Visualization
U.S. Government’s 2024 Budget Visualized
This was originally posted on our Voronoi app. Download the app for free on iOS or Android and discover incredible data-driven charts from a variety of trusted sources.
The U.S. government faced one of its largest budget deficits ever in fiscal year 2024, due to rising interest rates and government spending significantly exceeding revenue.
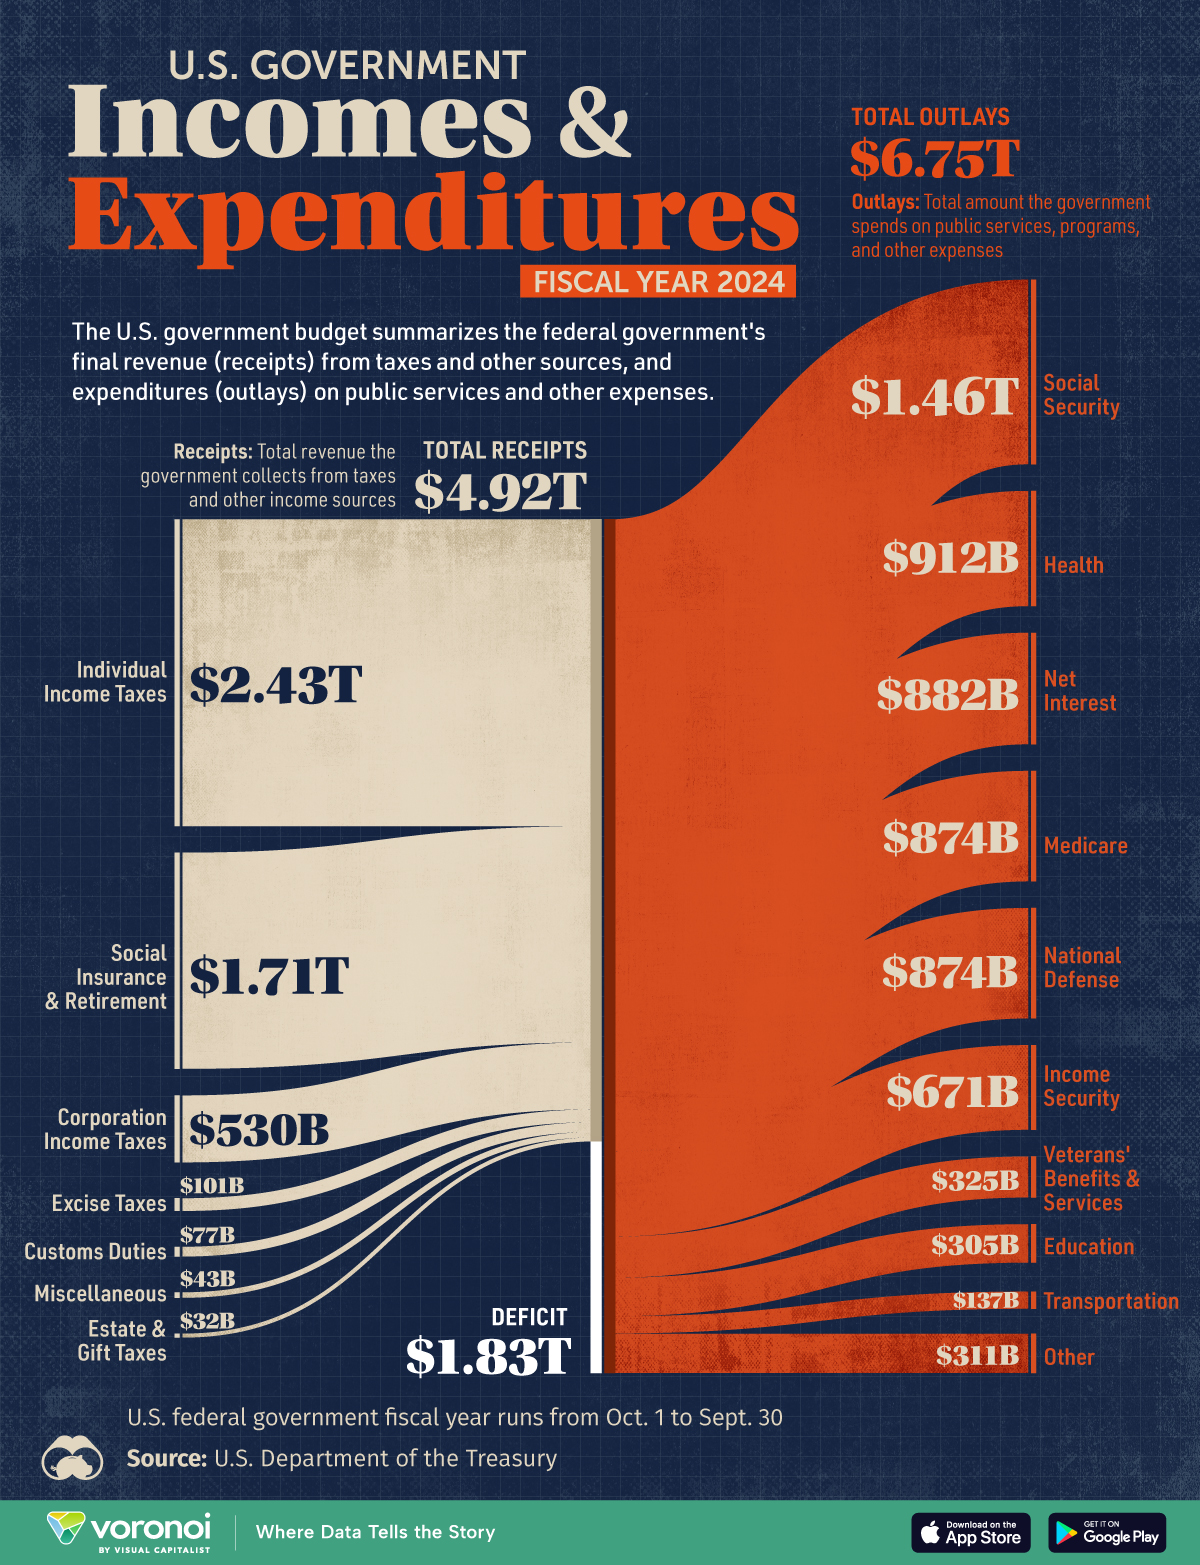
This graphic visualizes the U.S. government’s final budget results for the fiscal year 2024, showing the total receipts and outlays.
The data comes from the U.S. Department of the Treasury, with the U.S. fiscal year running from Oct. 1, 2023 to Sept. 30, 2024.
Receipts are the total revenue the government collects from taxes and other income sources. Meanwhile, outlays are the total amount the government spends on public services, programs, and other expenses.
U.S. Budget Deficit Reaches $1.8 Trillion in 2024
Below, we show the U.S. government’s total receipts by source and outlays by function for the fiscal year 2024.
| Category | Item | Amount (Billions) |
|---|---|---|
| Receipts by Source | Individual Income Taxes | $2,426 |
| Receipts by Source | Social Insurance & Retirement | $1,710 |
| Receipts by Source | Corporation Income Taxes | $530 |
| Receipts by Source | Excise Taxes | $101 |
| Receipts by Source | Customs Duties | $77 |
| Receipts by Source | Miscellaneous | $43 |
| Receipts by Source | Estate and Gift Taxes | $32 |
| Receipts by Source | Total Receipts | $4,919 |
| Outlays by Function | Social Security | $1,461 |
| Outlays by Function | Health | $912 |
| Outlays by Function | Net Interest | $882 |
| Outlays by Function | Medicare | $874 |
| Outlays by Function | National Defense | $874 |
| Outlays by Function | Income Security | $671 |
| Outlays by Function | Veterans' Benefits & Services | $325 |
| Outlays by Function | Education | $305 |
| Outlays by Function | Transportation | $137 |
| Outlays by Function | Other | $311 |
| Outlays by Function | Total Outlays | $6,752 |
| Deficit | $1,833 |
The U.S. government is currently running a significant deficit of $1.83 trillion, an increase of $138 billion from fiscal year 2023.
This marks the third-largest budget deficit in U.S. history, following the pandemic-related deficits of 2020 and 2021.
The largest portion of government receipts comes from individual income taxes, which account for $2.43 trillion of the total revenue, followed by Social Insurance & Retirement contributions at $1.71 trillion.
Total receipts increased by about $479 billion from 2023 to 2024.
The biggest spending categories for fiscal 2024 were Social Security at $1.46 trillion and health at $912 billion. Total outlays increased by about $617 billion from 2023 to 2024.
Gross interest payments on the U.S. debt continue to be a significant drag on the budget, surpassing the $1 trillion mark for the first time. Net interest payments, which account for gross interest payments minus any interest income the government receives, cost the government $882 billion in 2024—more than Medicare or defense spending.
Significant and increasing government debt is expected to cause the net interest burden reach over $1 trillion in the coming years.
Learn More on the Voronoi App
To learn more about the costs of government debt, check out this graphic that shows the net interest expense as a percentage of government revenue across major nations.
The post Breaking Down the U.S. Government’s 2024 Fiscal Year appeared first on Visual Capitalist.