The global information ecosystem is at a crossroads.
Trust in pretty much everything—from media and institutions to even our trust in ordinary people—sits at or near all-time lows.
I’ve always believed that data storytelling can help people get the right insights at the right time. That it can break down the facts in a trustworthy and intuitive way that empowers people to make better decisions: about their lives, their careers, and the direction of society.
It’s why we started Visual Capitalist 13 years ago, and it’s why we get 12 million visits (thank you!) to the website every month. But despite the amazing work our team does to visualize interesting data and megatrends, we’re only able to scratch the surface of what’s going on in the world.
More Data, More Problems
Above is how I sum up the main challenges in the realm of data storytelling.
But let’s dive deeper, and talk about both the pros and cons of data storytelling in the current (flawed) information ecosystem:
The Good News:
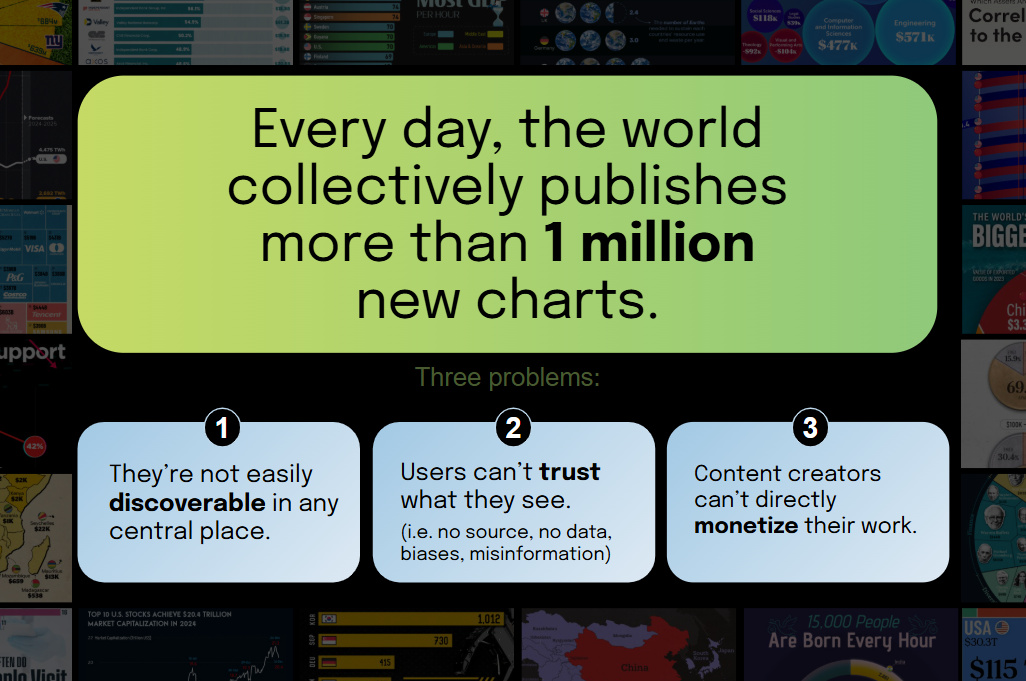
- There is a vast universe of data storytelling out there to be discovered, with over a million new charts, infographics, maps, and data visualizations created each day
- Many of these are timely and relevant. They can help you learn, form opinions, and make decisions in a complicated world
- There are incredible creators out there making charts and visualizations in every niche imaginable
The Bad News:
- Data storytelling is disparate and spread throughout the internet across many different platforms and places. There’s no obvious place to go to discover new data
- When something catches your eye, you can’t trust what you see. The data itself, the data source, and even who made it can be opaque or suspect
- Charts are often designed to elicit a reaction (i.e. outrage) because that gets clicks. Many use misinformation, biases, or cherry-picked data to trigger a reaction
- AI has sped up content creation, which means even more volume and noise for users to sift through
In the current information ecosystem, the bad outweighs the good. Polarization, echo chambers, and the inability to sort out real facts from misinformation have deepened rifts in society.
Meanwhile, even the best chart creators have no direct way to monetize. Their peers, making YouTube videos, TikTok shorts, Twitch streams, or Substack articles, all have built-in monetization that allows them to fully lean into their craft.
Our Bold Vision: A Platform for the World’s Data
To get different results, we can’t rely on the status quo. We have to change the way the information ecosystem itself works.
We need a new platform, specifically one that is:
| Parameter | Description |
|---|---|
| 1. Open | Available to all users, creators, and forms of data storytelling |
| 2. Trusted | Data, sources, and methodology are transparent and verifiable |
| 3. Discoverable | You can find the data you need, or it finds you automatically |
| 4. Personalized | The experience for each user is customized, because a programmer in Kenya is interested in different data than a financial advisor in New York |
| 5. Creator-Focused | Gives data creators the tools, support, and monetization options they need to be successful |
| 6. Large Scale | It needs to reach a minimum size to make an impact: 100 million users, 10,000 creators, and buy-in from major data sources |
Voronoi is That Platform
The good news is that we’ve taken matters into our own hands and have already started building this new platform. We launched the first version of the app, Voronoi (iOS, Android, web), just over a year ago.

Built on all the values above, we’ve already opened the doors to 120+ data creators who have posted over 4,000 data-driven visuals on a variety of subjects. Importantly each data story comes with pure transparency, where you can see the data behind the chart, data sources, and any methodology notes.
Though still at the minimum viable product (MVP) stage, Voronoi is already picking up major traction with over 200,000 monthly active users (MAUs).
Supercharging Voronoi’s Growth
Since launching, Voronoi has grown its users by about 26% every month.
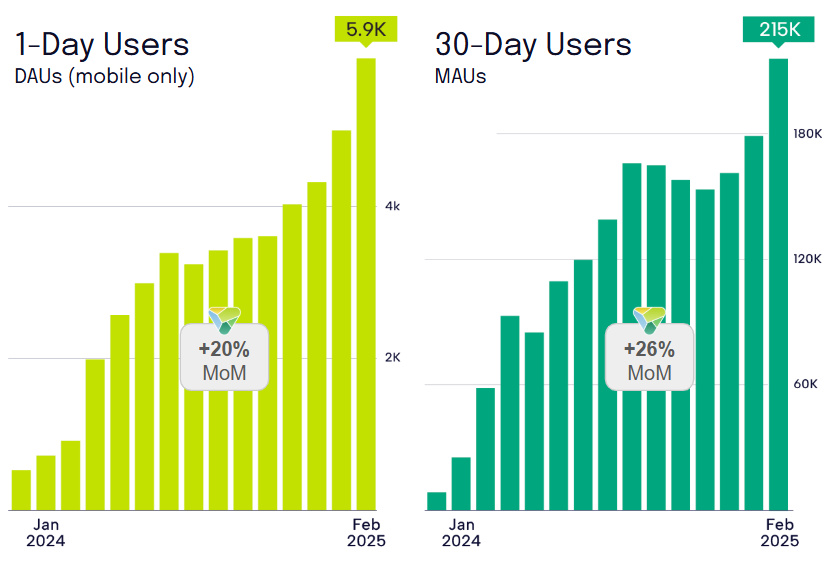
Meanwhile, average daily users (i.e. the ones that go on Voronoi day in and day out) have surged 64.4% since October.
But this just scratches the surface of what we think is possible.
Here’s our five year vision of where we think Voronoi can go:
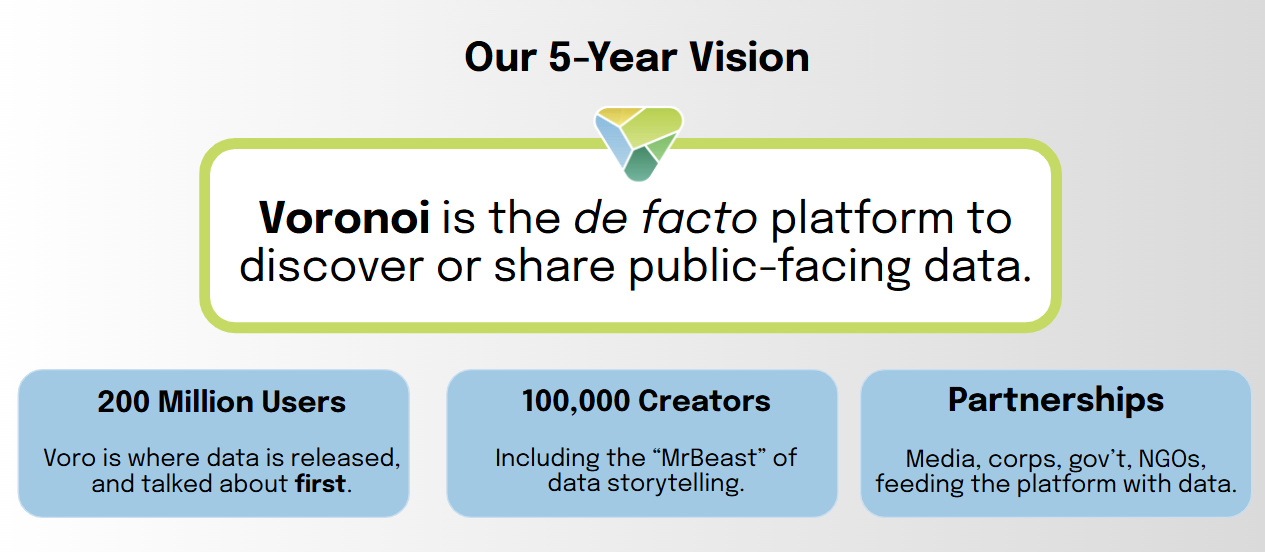
In the future, we want Voronoi to be where people go to discover, share, and discuss data. We even want it to be where businesses, media, academics, organizations, and governments go to release their newest data.
By uniting the data ecosystem under one banner, we believe there is a once-in-a-lifetime business opportunity as well.
(And don’t worry, Visual Capitalist is not going anywhere. It will continue to be a center of excellence for data storytelling and a high-profile creator on Voronoi.)
Achieving Our Vision Requires Capital: We Need Your Help
To build the world’s data discovery platform to its potential, we need your help.
I’m asking here because in the 13 years of Visual Capitalist’s existence, I’ve realized how powerful and amazing our following is.
What we need: connections to like-minded investors (venture capital, family offices, other accredited investors like angels) that can help us raise a seed round of capital to get to the next steps in our roadmap and vision.
If you are someone, or if you know someone who can help that believes in this mission—please email me at: [email protected]
Sincerely,
Jeff Desjardins
Founder of Visual Capitalist and Founder of Voronoi
The post Why We’re Going All-In on Voronoi to Unify the World’s Data appeared first on Visual Capitalist.