![]()
See this visualization first on the Voronoi app.
U.S. States By Share of Adults Aged 65 or Older
This was originally posted on our Voronoi app. Download the app for free on iOS or Android and discover incredible data-driven charts from a variety of trusted sources.
The U.S. population is aging, and some states have a significantly higher share of older adults than others.
From 1980 to 2022, the median age of the population increased from 30.0 to 38.9, according to data from the Population Reference Bureau.
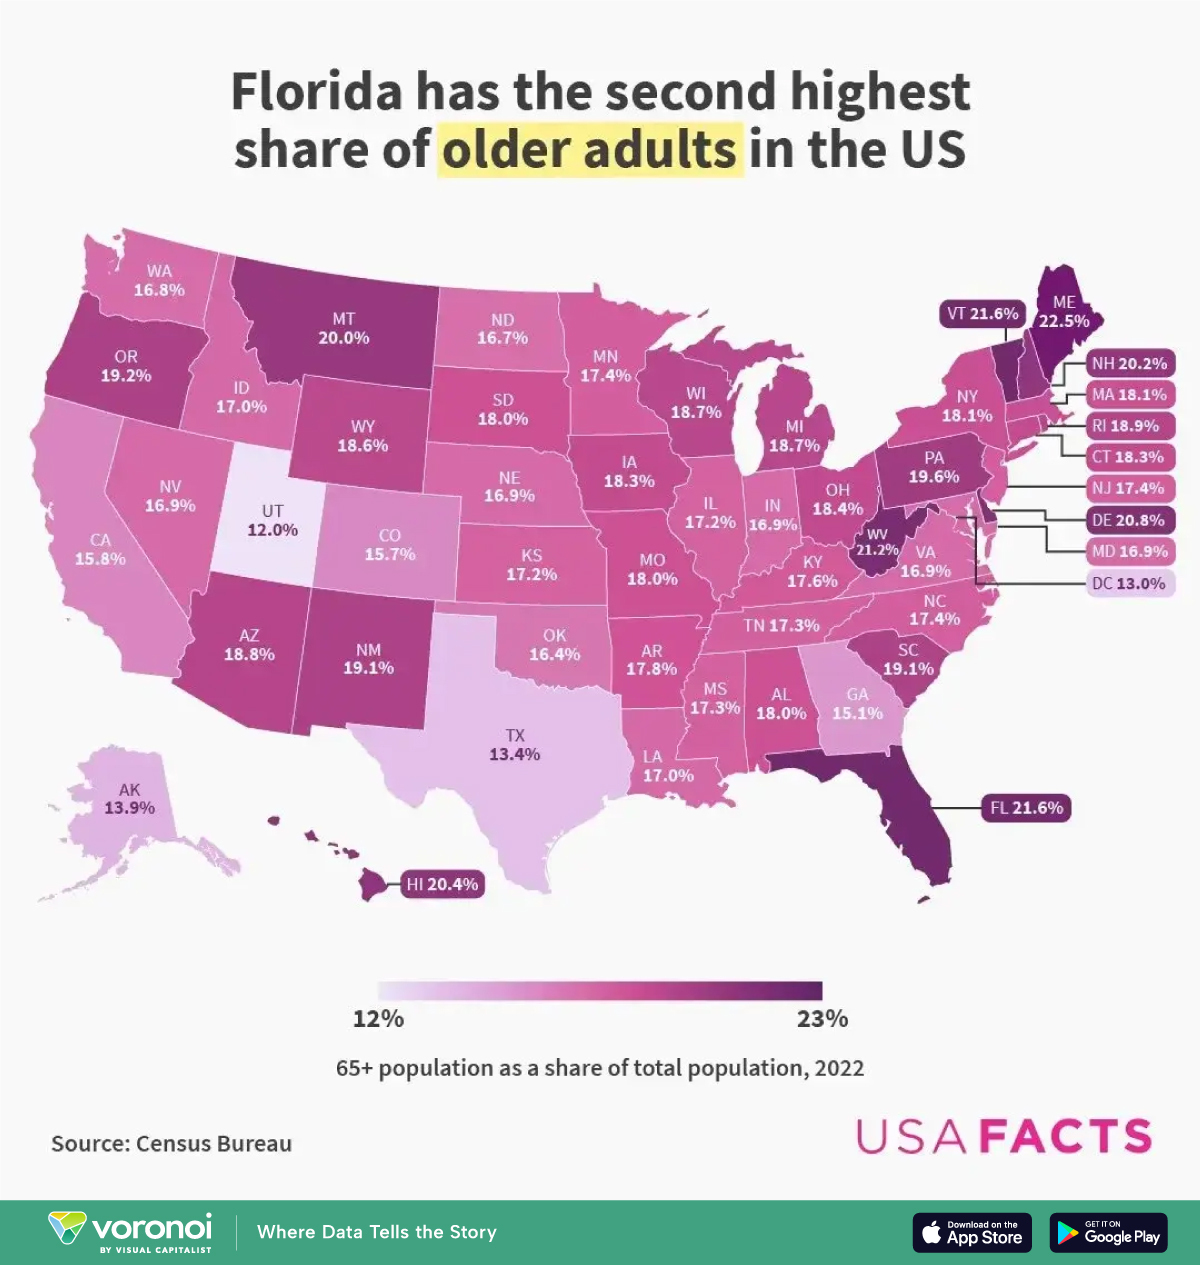
This map by USAFacts visualizes the share of older adults (65+) by state in 2022 using data from the Census Bureau.
Which State Has the Highest Share of Older Adults?
Below, we show the share of older adults (65+) by state in 2022.
| State | Share of population 65+ |
|---|---|
| Maine | 22.5% |
| Florida | 21.6% |
| Vermont | 21.6% |
| West Virginia | 21.2% |
| Delaware | 20.8% |
| Hawaii | 20.4% |
| New Hampshire | 20.2% |
| Montana | 20.0% |
| Pennsylvania | 19.6% |
| Oregon | 19.2% |
| South Carolina | 19.1% |
| New Mexico | 19.1% |
| Rhode Island | 18.9% |
| Arizona | 18.8% |
| Michigan | 18.7% |
| Wisconsin | 18.7% |
| Wyoming | 18.6% |
| Ohio | 18.4% |
| Connecticut | 18.3% |
| Iowa | 18.3% |
| Massachusetts | 18.1% |
| New York | 18.1% |
| Alabama | 18.0% |
| Missouri | 18.0% |
| South Dakota | 18.0% |
| Arkansas | 17.8% |
| Kentucky | 17.6% |
| North Carolina | 17.4% |
| New Jersey | 17.4% |
| Minnesota | 17.4% |
| Tennessee | 17.3% |
| Mississippi | 17.3% |
| Kansas | 17.2% |
| Illinois | 17.2% |
| Idaho | 17.0% |
| Louisiana | 17.0% |
| Nevada | 16.9% |
| Indiana | 16.9% |
| Nebraska | 16.9% |
| Virginia | 16.9% |
| Maryland | 16.9% |
| Washington | 16.8% |
| North Dakota | 16.7% |
| Oklahoma | 16.4% |
| California | 15.8% |
| Colorado | 15.7% |
| Georgia | 15.1% |
| Alaska | 13.9% |
| Texas | 13.4% |
| Utah | 12.0% |
As of 2022, Maine had the highest share of older adults at 22.5%, followed by Florida and Vermont at 21.6%.
Maine, which has long seen young residents move elsewhere for jobs, also has the highest median age in the nation at 44.8 years.
Meanwhile, Florida’s high share of older residents reflects its long-standing popularity as a retirement destination due to its warm climate, tax benefits, and senior-friendly communities.
The high share of older adults in states like Maine and Florida affects healthcare demand, workforce participation, and housing markets, shaping local economies and public policy.
That said, it’s still quite common for Americans older than 65 to continue to work, with 22% still employed in 2024. New Jersey had the highest share of working adults aged 65 and over in 2024.
Learn More on the Voronoi App ![]()
What are the 25 best countries to retire in? See this graphic on Voronoi to find out.
The post Map: U.S. States by Share of Older Adults (65+) appeared first on Visual Capitalist.