![]()
See this visualization first on the Voronoi app.
Use This Visualization
How Does Trump’s Approval Rating Compare to Past Presidents?
This was originally posted on our Voronoi app. Download the app for free on iOS or Android and discover incredible data-driven charts from a variety of trusted sources.
Donald Trump is kicking off his second term with relatively low public support, showing little sign of the typical post-election boost.
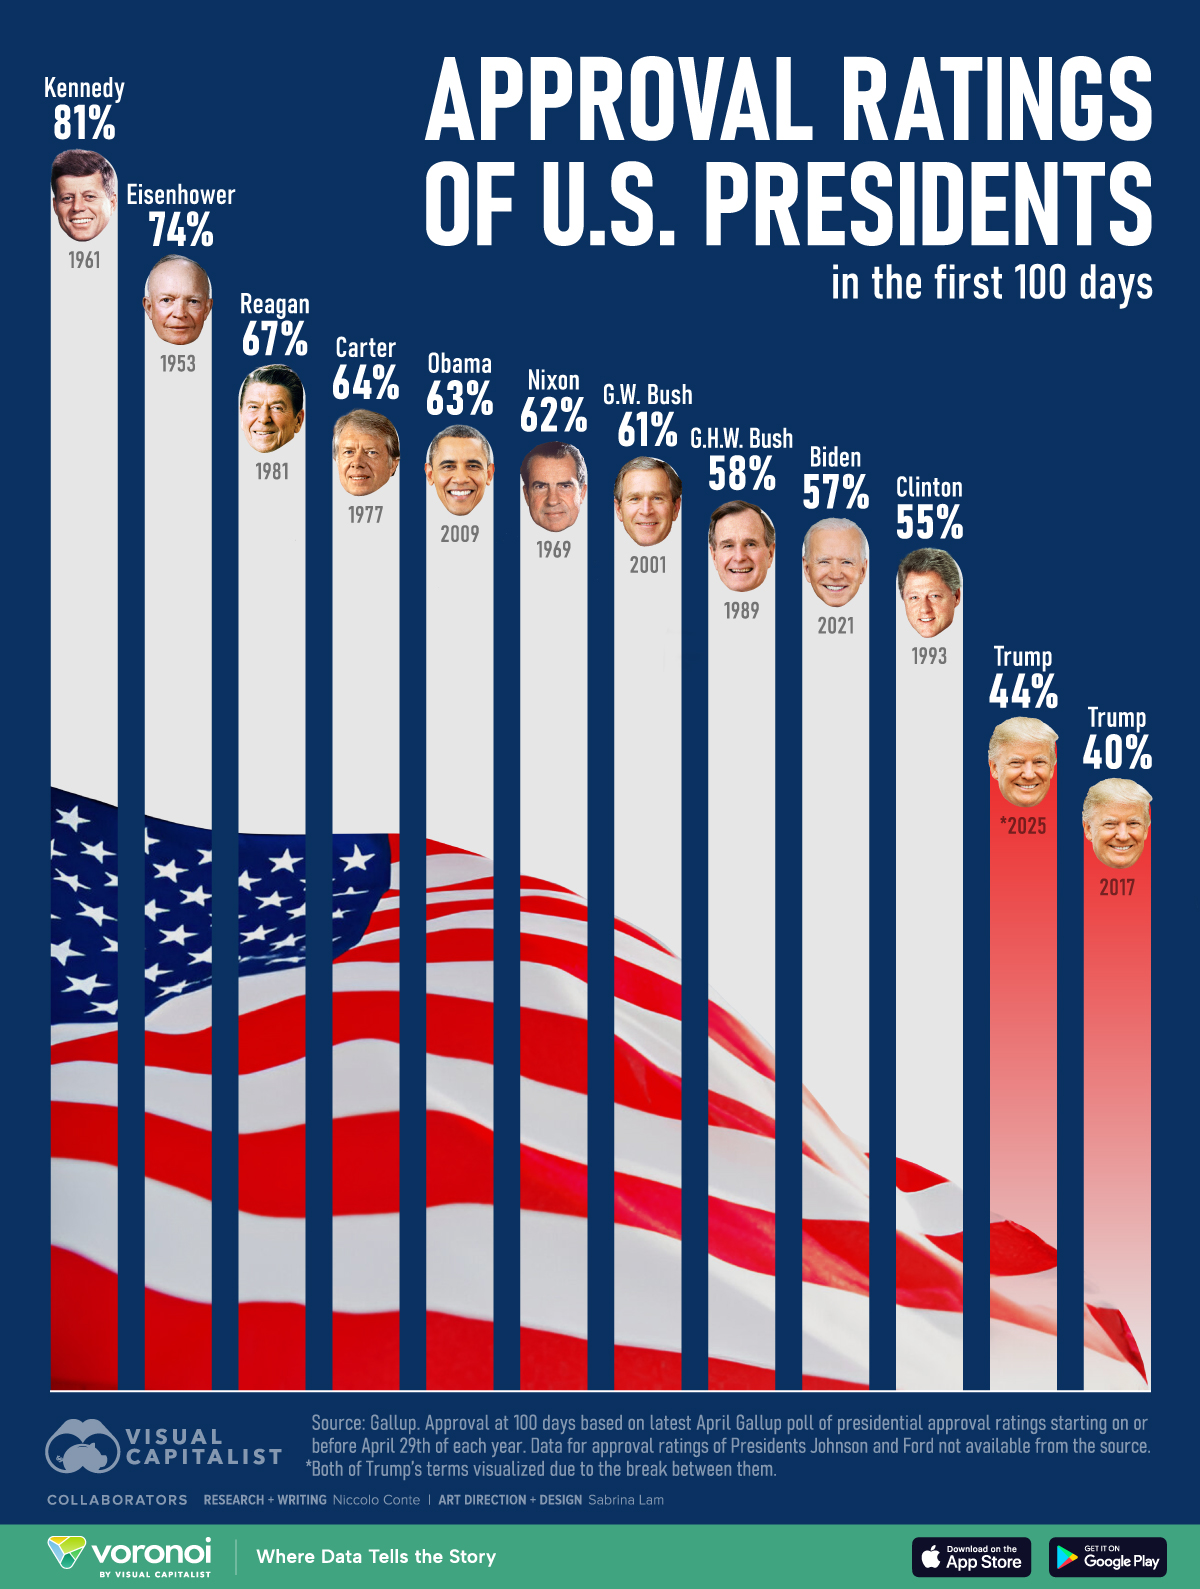
This graphic visualizes the approval ratings of recent U.S. presidents in their first 100 days in office.
Approval ratings are based on the latest April Gallup poll of presidential approval starting on or before April 29th of each year. Ratings for Lyndon B. Johnson and Gerald Ford were not available.
Both of Trump’s first and second terms are visualized because there was a break between them, unlike other presidents who served one or two consecutive terms.
Trump’s Second Term is Off to a Cold Start
Below, we show the approval ratings of recent U.S. presidents in their first 100 days in office.
| Year | President | 100-Day Approval Rating (%) |
|---|---|---|
| 1961 | Kennedy | 81 |
| 1953 | Eisenhower | 74 |
| 1981 | Reagan | 67 |
| 2009 | Obama | 63 |
| 1977 | Carter | 64 |
| 2001 | G.W. Bush | 61 |
| 1969 | Nixon | 62 |
| 1989 | G.H.W. Bush | 58 |
| 2021 | Biden | 57 |
| 1993 | Clinton | 55 |
| 2025 | Trump (2nd term) | 44 |
| 2017 | Trump (1st term) | 40 |
Donald Trump began his second term with an approval rating of 47% in January, dipping to 44% by April—marking one of the weakest starts to a presidential term in modern history.
This is only slightly higher than the 40% approval rating he held during the first 100 days of his first term, the lowest ever recorded for a newly elected modern U.S. president.
By contrast, most of Trump’s predecessors benefited from a “honeymoon period,” with early approval ratings well above 50%.
The average first-quarter approval rating for presidents elected between 1952 and 2020 is 60%, according to Gallup, with John F. Kennedy leading the pack at 81%.
According to Gallup, a majority of Americans said they have either “only a little” (11%) or almost no (44%) confidence in the president to do the right thing for the economy.
The U.S. economy stumbled out of the gate in the beginning of Trump’s second term, with GDP projected to shrink by 0.3% in Q1 2025—the first quarterly decline since early 2022.
The U.S. stock market has also seen major volatility amid tariff announcements and rollbacks, falling 21% from its peak in February.
Learn More on the Voronoi App ![]()
To learn more about approval ratings of various world leaders, check out this graphic that visualizes the approval ratings of leaders in 24 major countries around the world based on January data.