![]()
See this visualization first on the Voronoi app.
Use This Visualization
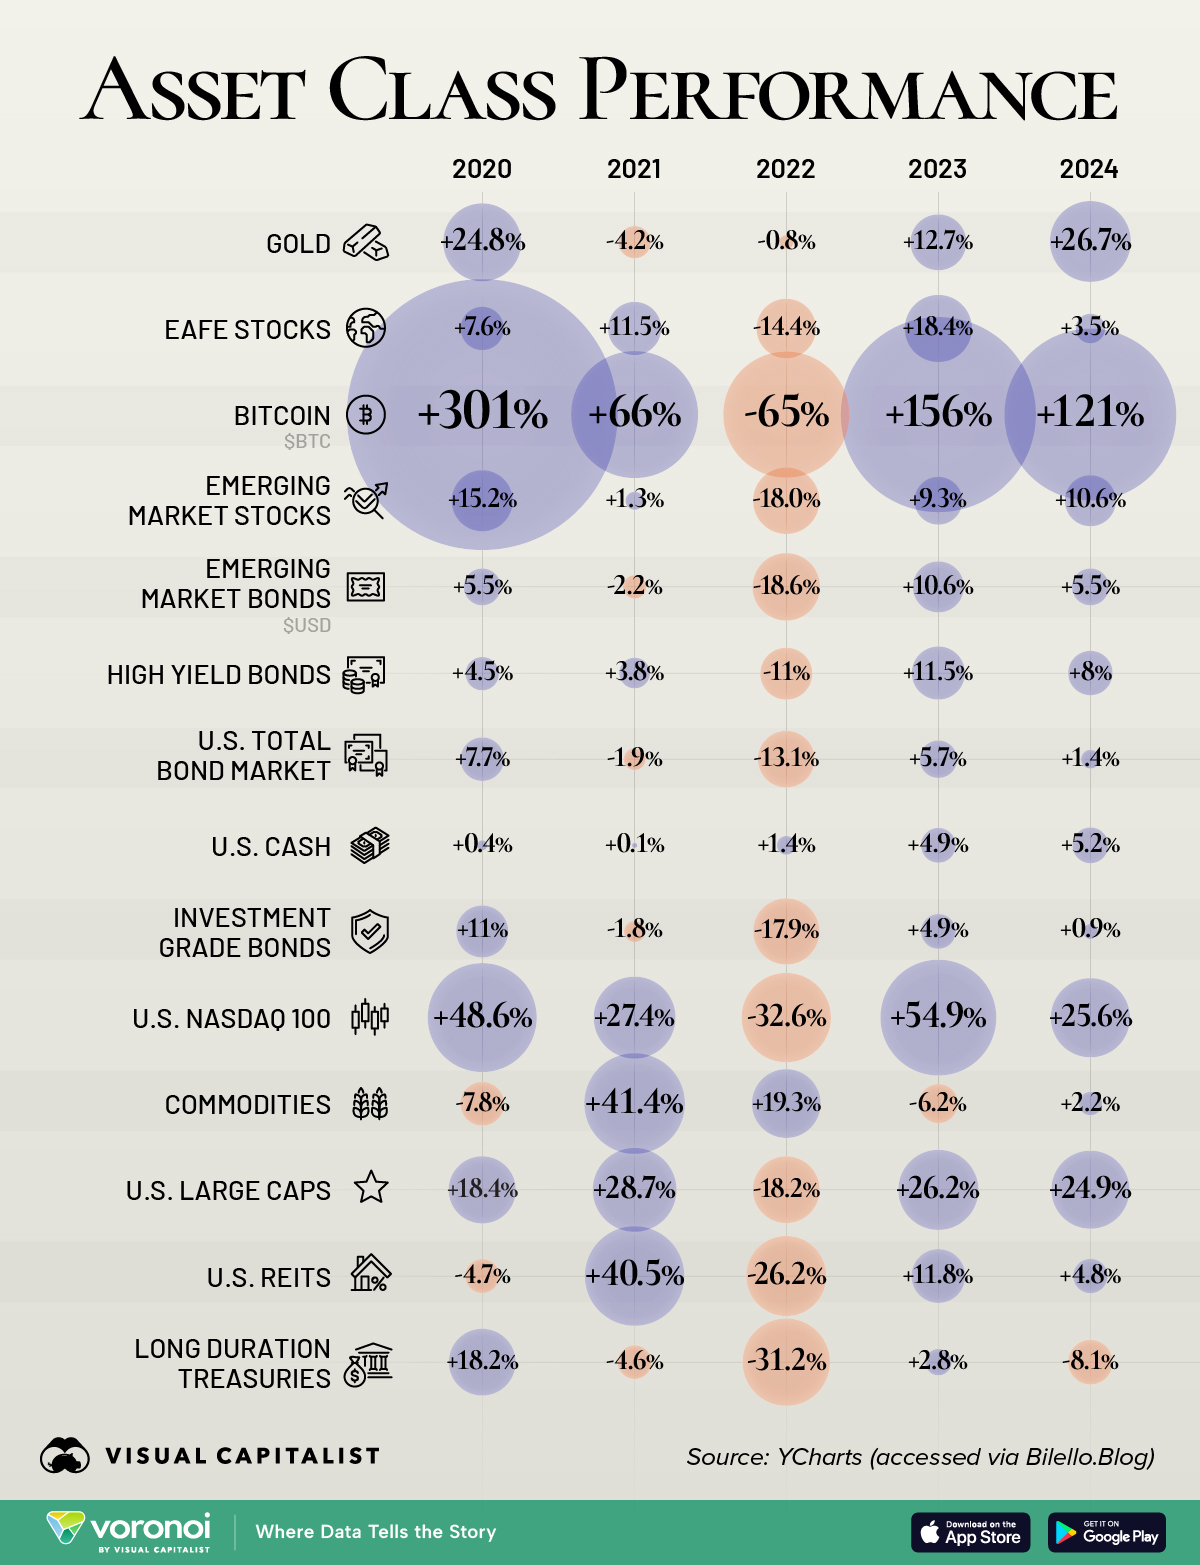
How Major Asset Classes Have Performed Since 2020
This was originally posted on our Voronoi app. Download the app for free on iOS or Android and discover incredible data-driven charts from a variety of trusted sources.
Key Takeaways
- Bitcoin climbed 301% in 2020 as investors flocked to it as an inflation hedge and institutional adoption grew
- Gold surged in 2024 as falling interest rates and persistent geopolitical uncertainty boosted demand for safe-haven assets
Over the past five years, asset classes have experienced significant shifts, influenced by global events and economic policies. This infographic illustrates the annual performance of major asset classes from 2020 to 2024, highlighting the volatility and resilience across different assets during this period.
Data & Discussion
The data, sourced from Bilello.blog, provides a comprehensive overview of annual returns for various asset classes between 2020 and 2024.
| ETF | Asset Class | 2020 | 2021 | 2022 | 2023 | 2024 |
|---|---|---|---|---|---|---|
| GLD | Gold | 24.8% | -4.2% | -0.8% | 12.7% | 26.7% |
| EFA | EAFE Stocks | 7.6% | 11.5% | -14.4% | 18.4% | 3.5% |
| N/A | Bitcoin ($BTC) | 301% | 66% | -65% | 156% | 121% |
| VWO | EM Stocks | 15.2% | 1.3% | -18% | 9.3% | 10.6% |
| EMB | EM Bonds (USD) | 5.5% | -2.2% | -18.6% | 10.6% | 5.5% |
| HYG | High Yield Bonds | 4.5% | 3.8% | -11% | 11.5% | 8% |
| BND | US Total Bond Market | 7.7% | -1.9% | -13.1% | 5.7% | 1.4% |
| BIL | US Cash | 0.4% | 0.1% | 1.4% | 4.9% | 5.2% |
| LQD | Investment Grade Bonds | 11% | -1.8% | -17.9% | 4.9% | 0.9% |
| QQQ | US Nasdaq 100 | 48.6% | 27.4% | -32.6% | 54.9% | 25.6% |
| DBC | Commodities | -7.8% | 41.4% | 19.3% | -6.2% | 2.2% |
| SPY | US Large Caps | 18.4% | 28.7% | -18.2% | 26.2% | 24.9% |
| VNQ | US REITs | -4.7% | 40.5% | -26.2% | 11.8% | 4.8% |
| TLT | Long Duration Treasuries | 18.2% | -4.6% | -31.2% | 2.8% | -8.1% |
Bitcoin’s Volatility and Growth
Bitcoin experienced a remarkable surge of 301% in 2020, driven by rising investor interest in cryptocurrencies. Despite a significant drop of 65% in 2022, it rebounded with gains of 156% in 2023 and 121% in 2024, showcasing its unprecedented volatility and return potential.
Gold’s Resilience Amid Uncertainty
Gold demonstrated resilience, particularly in 2024, with a 26.7% increase, as investors sought safe-haven assets amid falling interest rates and geopolitical tensions. Its performance highlights gold’s traditional role as a store of value during periods of economic instability and market volatility.
U.S. Equities
US equities, represented by the S&P 500 (SPY), showed strong performance in 2021 and 2023, with gains of 28.7% and 26.2% respectively. However, 2022 saw a significant decline of 18.2%, setting a record for the biggest annual drop since 2008.
2025 has been another rocky year so far due to escalating tariff threats. When focusing on the first 73 trading days of a year, 2025 is the S&P 500’s fifth worst year in history.
Learn More on the Voronoi App ![]()
If you enjoyed today’s post, check out this visual breakdown of global market capitalization on Voronoi, the new app from Visual Capitalist.