![]()
See this visualization first on the Voronoi app.
Use This Visualization
Ranked: U.S. States from Most to Least Expensive
This was originally posted on our Voronoi app. Download the app for free on iOS or Android and discover incredible data-driven charts from a variety of trusted sources.
Key Takeaways
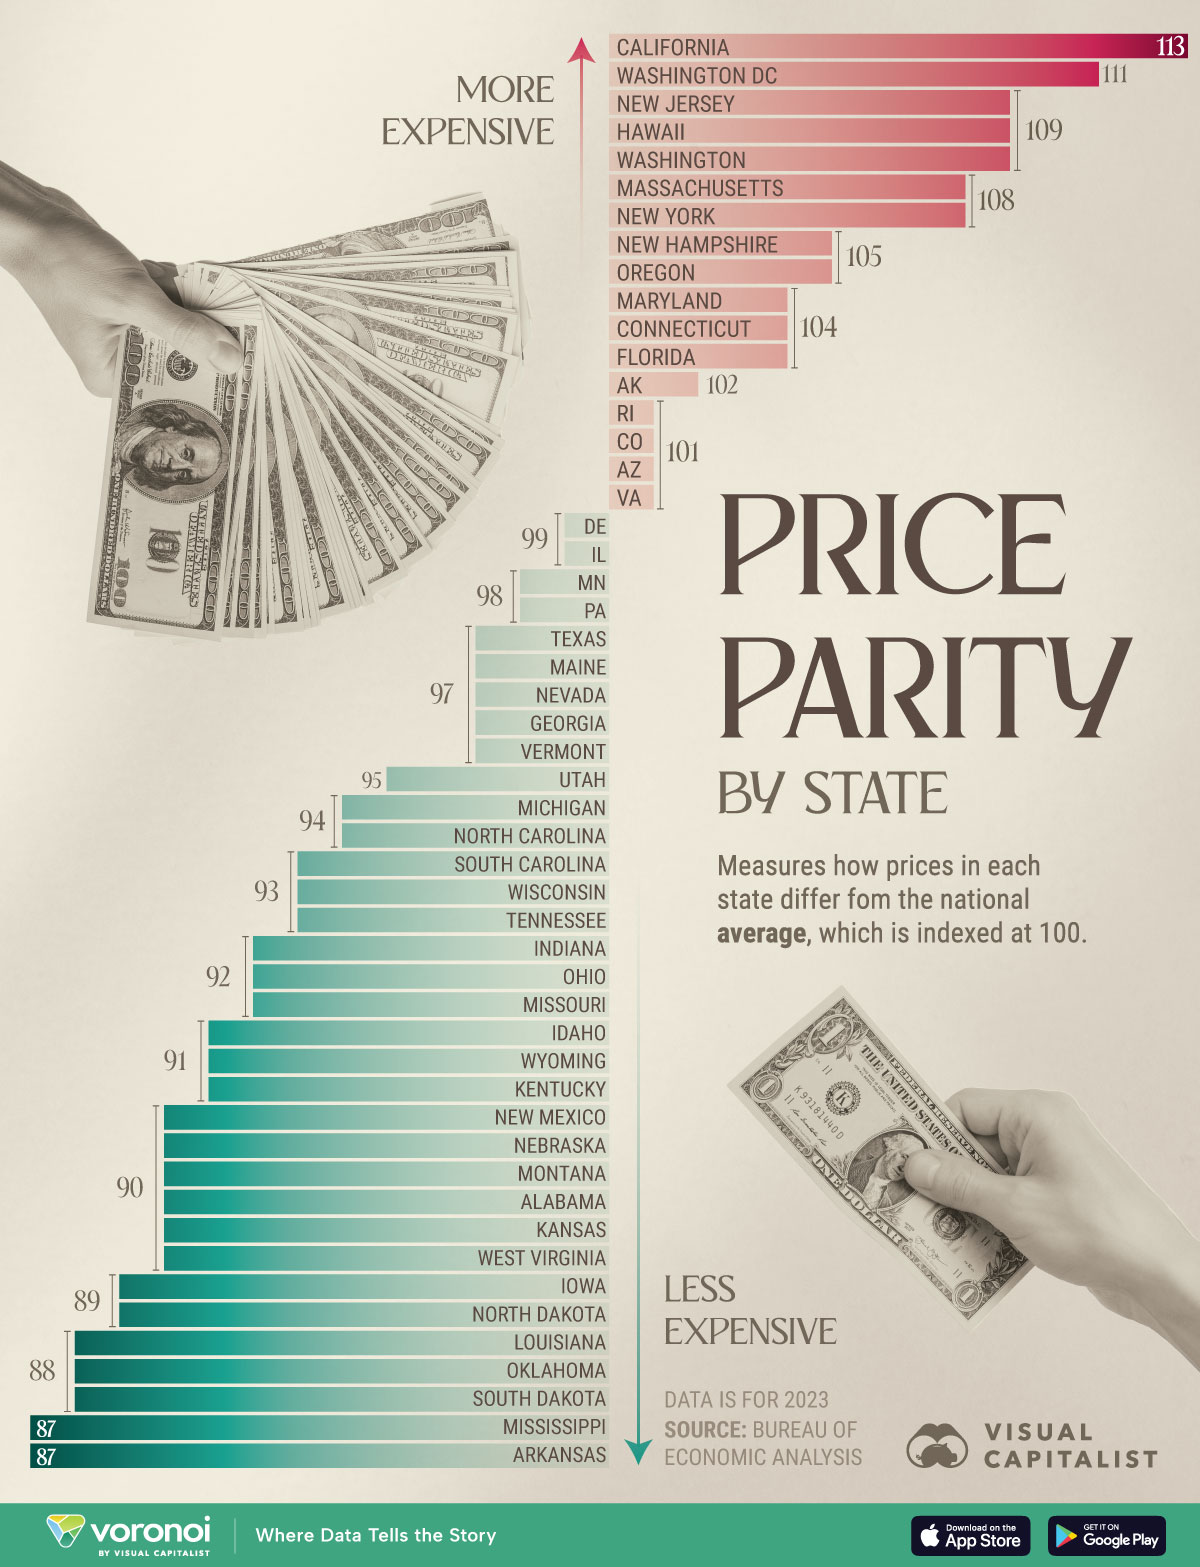
- California stands as the nation’s most expensive state, with a regional price parity (RPP) of 113 when indexed against the U.S. average of 100.
- Following in second is Washington D.C., with a RPP of 111—driven significantly by housing costs.
- Arkansas ranks as the least expensive state, with costs 13% lower than the national average.
How far does a dollar really go across America?
As inflation has raised everything from housing costs to the price of eggs to record levels, consumers are feeling the burden. While tariffs stand to raise prices even further—although no meaningful signs in official data show this yet—price pressures have few signs of abating.
This graphic shows price parity by U.S. state based on data from the Bureau of Economic Analysis (BEA).
How Price Parity Compares Across America
To show the differences in prices across the country, the BEA compared each state to the national average, represented as 100 as of 2023.
| State | Regional Price Parity (U.S. = 100) |
|---|---|
| California | 113 |
| Washington DC | 111 |
| New Jersey | 109 |
| Hawaii | 109 |
| Washington | 109 |
| Massachusetts | 108 |
| New York | 108 |
| New Hampshire | 105 |
| Oregon | 105 |
| Maryland | 104 |
| Connecticut | 104 |
| Florida | 104 |
| Alaska | 102 |
| Rhode Island | 101 |
| Colorado | 101 |
| Arizona | 101 |
| Virginia | 101 |
| Delaware | 99 |
| Illinois | 99 |
| Minnesota | 98 |
| Pennsylvania | 98 |
| Texas | 97 |
| Maine | 97 |
| Nevada | 97 |
| Georgia | 97 |
| Vermont | 97 |
| Utah | 95 |
| Michigan | 94 |
| North Carolina | 94 |
| South Carolina | 93 |
| Wisconsin | 93 |
| Tennessee | 93 |
| Indiana | 92 |
| Ohio | 92 |
| Missouri | 92 |
| Idaho | 91 |
| Wyoming | 91 |
| Kentucky | 91 |
| New Mexico | 90 |
| Nebraska | 90 |
| Montana | 90 |
| Alabama | 90 |
| Kansas | 90 |
| West Virginia | 90 |
| Iowa | 89 |
| North Dakota | 89 |
| Louisiana | 88 |
| Oklahoma | 88 |
| South Dakota | 88 |
| Mississippi | 87 |
| Arkansas | 87 |
Ranking as the nation’s most expensive state, prices in California are 13% higher than the national average.
In particular, California’s housing rents are 58% higher overall, second-only to Washington, D.C.. at 69% in 2023. Typically, housing is the primary driver of price disparities across the country.
At the same time, Californians pay more for groceries than any other state—at around 10% higher than the U.S. average.
Ranking in third is New Jersey, driven largely by its proximity to New York. In addition to high housing costs, a separate report shows that people in the Garden State pay 32% more for household bills like utilities and health insurance than the U.S. average.
At the other end of the spectrum, southern states like Arkansas and Mississippi offer some of the lowest costs of living. In August 2024, the median home sale price in Arkansas was just $203,067 compared to the U.S. median of about $385,000. Beyond housing costs, daily expenses like transportation and utilities are also comparatively lower.
Similarly, median home prices in Mississippi stand at just $183,507, however, median household incomes fall below the national average, at $55,060.
Learn More on the Voronoi App ![]()
To learn more about this topic from an affordability perspective, check out this graphic on home affordability scores by U.S. state.