![]()
See this visualization first on the Voronoi app.
Use This Visualization
Chart: The Plummeting Cost of Renewable Energy
This was originally posted on our Voronoi app. Download the app for free on iOS or Android and discover incredible data-driven charts from a variety of trusted sources.
Key Takeaways
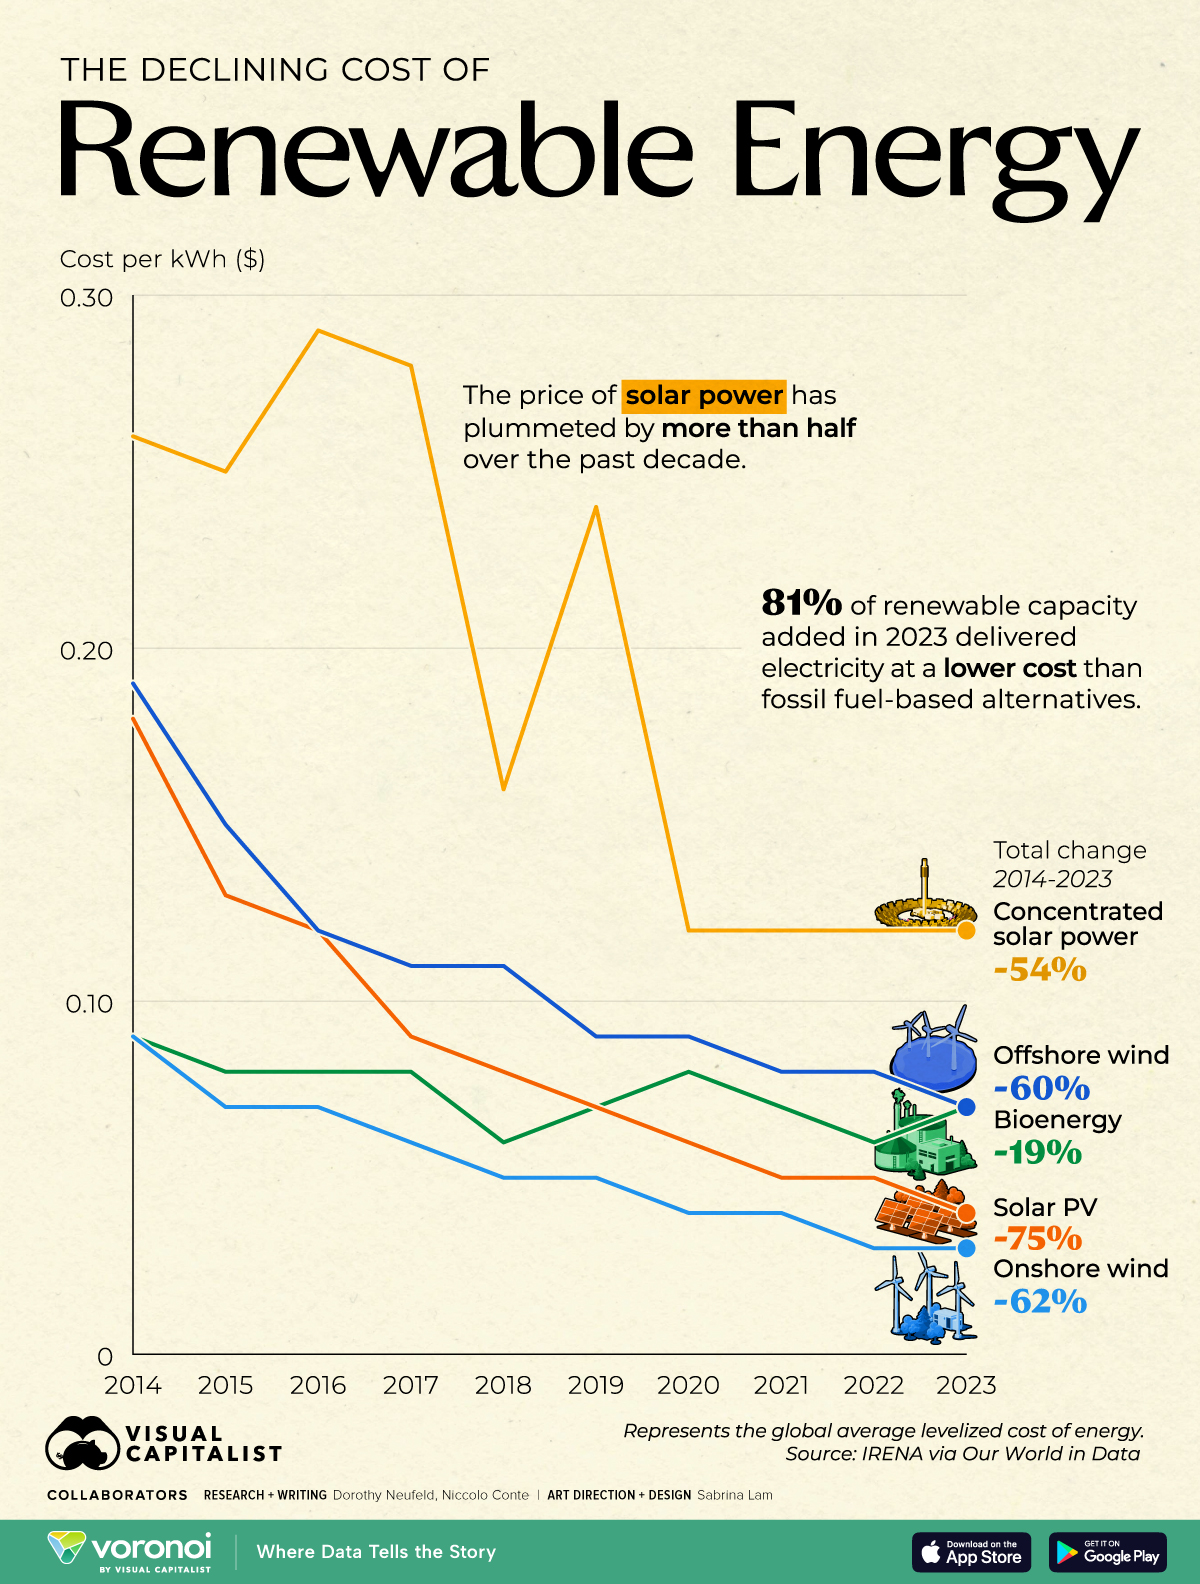
- The price of concentrated solar power declined by 54% since 2014 and solar photovoltaic (PV) declined by 75%.
- Concentrated solar power, which uses mirrors to produce concentrated sunlight, stood at a $53 billion market in 2023.
- Wind power is at least 60% less expensive than in 2014, driven by larger generating capacity and technical advancements improving installation costs.
Renewable energy is getting cheaper—fast.
In 2023, 81% of new renewable power capacity was more cost-effective than fossil fuel alternatives. This follows Wright’s Law, which observes that technology costs fall as production scales, a trend playing out in green energy today.
This graphic shows the cost of renewable energy over the past decade, based on data from IRENA via Our World in Data.
Timeline: Renewable Energy Costs Since 2014
In the table below, we show how each of the following green energy sources have witnessed double-digit cost declines in 10 years:
| Cost per kWh ($) | Concentrated solar power | Offshore wind | Bioenergy | Solar PV | Onshore wind |
|---|---|---|---|---|---|
| 2023 | 0.12 | 0.07 | 0.07 | 0.04 | 0.03 |
| 2022 | 0.12 | 0.08 | 0.06 | 0.05 | 0.03 |
| 2021 | 0.12 | 0.08 | 0.07 | 0.05 | 0.04 |
| 2020 | 0.12 | 0.09 | 0.08 | 0.06 | 0.04 |
| 2019 | 0.24 | 0.09 | 0.07 | 0.07 | 0.05 |
| 2018 | 0.16 | 0.11 | 0.06 | 0.08 | 0.05 |
| 2017 | 0.28 | 0.11 | 0.08 | 0.09 | 0.06 |
| 2016 | 0.29 | 0.12 | 0.08 | 0.12 | 0.07 |
| 2015 | 0.25 | 0.15 | 0.08 | 0.13 | 0.07 |
| 2014 | 0.26 | 0.19 | 0.09 | 0.18 | 0.09 |
| Total change2014-2023 | -54.2% | -60.0% | -19.4% | -75.0% | -62.3% |
As we can see, solar PV energy is now 75% cheaper than in 2014.
As costs become increasingly favorable, installed solar capacity is growing by about twofold every three years. In 2025, an estimated $450 billion in investment is projected to go toward solar energy worldwide alone.
Meanwhile, the cost of onshore wind has fallen by 62.3% and offshore by 60%. Over the decade, capacity has similarly boomed as wind turbines have grown bigger. In this way, larger blades produce wind power more efficiently, driving down costs and requiring fewer turbines.
Together, falling costs and rapid capacity growth are strengthening the case for a shift away from fossil fuels. Big tech is among those leading the charge, pouring billions into data centers where green energy is projected to account for 40% of new power capacity.
Learn More on the Voronoi App ![]()
To learn more about this topic from a U.S.-based perspective, check out this graphic on the growth in renewable energy capacity over the past decade in America.