![]()
See this visualization first on the Voronoi app.
Use This Visualization
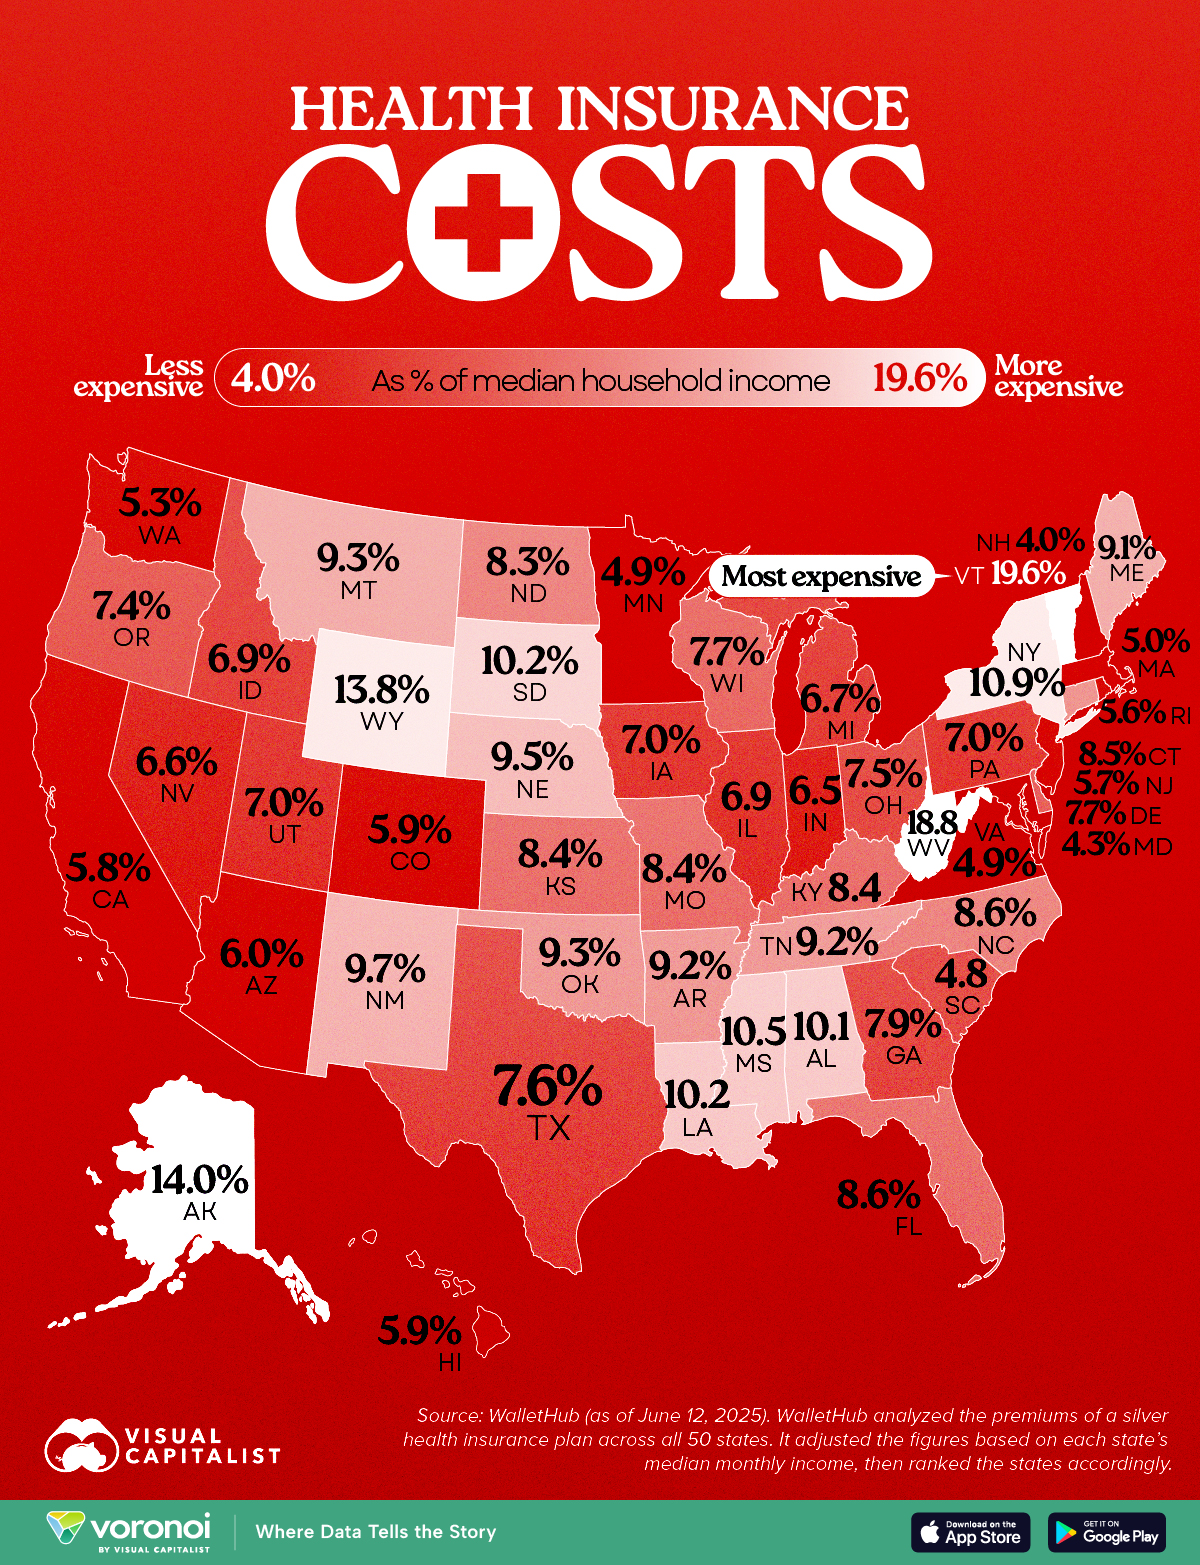
Health Insurance as a Share of Median Income by U.S. State
This was originally posted on our Voronoi app. Download the app for free on iOS or Android and discover incredible data-driven charts from a variety of trusted sources.
Key Takeaways
- Vermont tops the list, with insurance costing 19.6% of median income.
- New Hampshire residents spend just 4% of their income on health insurance, the lowest in the nation.
Americans pay wildly different amounts for health insurance depending on where they live. This map shows which states pay the most (and least) when health insurance costs are measured as a share of median income.
The data for this visualization comes from WalletHub. It analyzed silver-tier health plan premiums in all 50 states and compared them to local median incomes to determine cost burdens.
Vermont and West Virginia Lead in Cost Burden
In Vermont, residents spend 19.6% of their monthly income on health insurance, the highest share in the country. West Virginia follows closely at 18.8%.
| Rank | State | Insurance as % of Income |
|---|---|---|
| 1 | Vermont | 19.6% |
| 2 | West Virginia | 18.8% |
| 3 | Alaska | 14.0% |
| 4 | Wyoming | 13.8% |
| 5 | New York | 10.9% |
| 6 | Mississippi | 10.5% |
| 7 | South Dakota | 10.2% |
| 8 | Louisiana | 10.2% |
| 9 | Alabama | 10.1% |
| 10 | New Mexico | 9.7% |
| 11 | Nebraska | 9.5% |
| 12 | Oklahoma | 9.3% |
| 13 | Montana | 9.3% |
| 14 | Arkansas | 9.2% |
| 15 | Tennessee | 9.2% |
| 16 | Maine | 9.1% |
| 17 | North Carolina | 8.6% |
| 18 | Florida | 8.6% |
| 19 | Connecticut | 8.5% |
| 20 | Missouri | 8.4% |
| 21 | South Carolina | 8.4% |
| 22 | Kansas | 8.4% |
| 23 | Kentucky | 8.4% |
| 24 | North Dakota | 8.3% |
| 25 | Georgia | 7.9% |
| 26 | Wisconsin | 7.7% |
| 27 | Delaware | 7.7% |
| 28 | Texas | 7.6% |
| 29 | Ohio | 7.5% |
| 30 | Oregon | 7.4% |
| 31 | Iowa | 7.0% |
| 32 | Utah | 7.0% |
| 33 | Pennsylvania | 7.0% |
| 34 | Idaho | 6.9% |
| 35 | Illinois | 6.9% |
| 36 | Michigan | 6.7% |
| 37 | Nevada | 6.6% |
| 38 | Indiana | 6.5% |
| 39 | Arizona | 6.0% |
| 40 | Hawaii | 5.9% |
| 41 | Colorado | 5.9% |
| 42 | California | 5.8% |
| 43 | New Jersey | 5.7% |
| 44 | Rhode Island | 5.6% |
| 45 | Washington | 5.3% |
| 46 | Massachusetts | 5.0% |
| 47 | Minnesota | 4.9% |
| 48 | Virginia | 4.9% |
| 49 | Maryland | 4.3% |
| 50 | New Hampshire | 4.0% |
The South and Mountain West Feel the Pinch
Many Southern and Mountain West states, like Mississippi, Wyoming, and Louisiana, also rank high in insurance cost burden. These regions tend to have poorer health outcomes and lower median incomes, exacerbating affordability issues. As Brookings notes, Medicaid expansion status and rural demographics heavily influence insurance markets in these areas.
New Hampshire and the Northeast Are Least Burdened
New Hampshire residents spend just 4% of their income on health insurance, the lowest in the nation.
Massachusetts, Maryland, and Minnesota also enjoy low cost burdens. These states often have robust state-run exchanges, higher incomes, and broader Medicaid expansion, all of which help reduce costs.
Learn More on the Voronoi App ![]()
If you enjoyed today’s post, check out Ranked: U.S. Cities With the Most and Least Health Insurance on Voronoi, the new app from Visual Capitalist.