![]()
See this visualization first on the Voronoi app.
Use This Visualization
Mapped: Unemployment by State in 2025
This was originally posted on our Voronoi app. Download the app for free on iOS or Android and discover incredible data-driven charts from a variety of trusted sources.
Key Takeaways
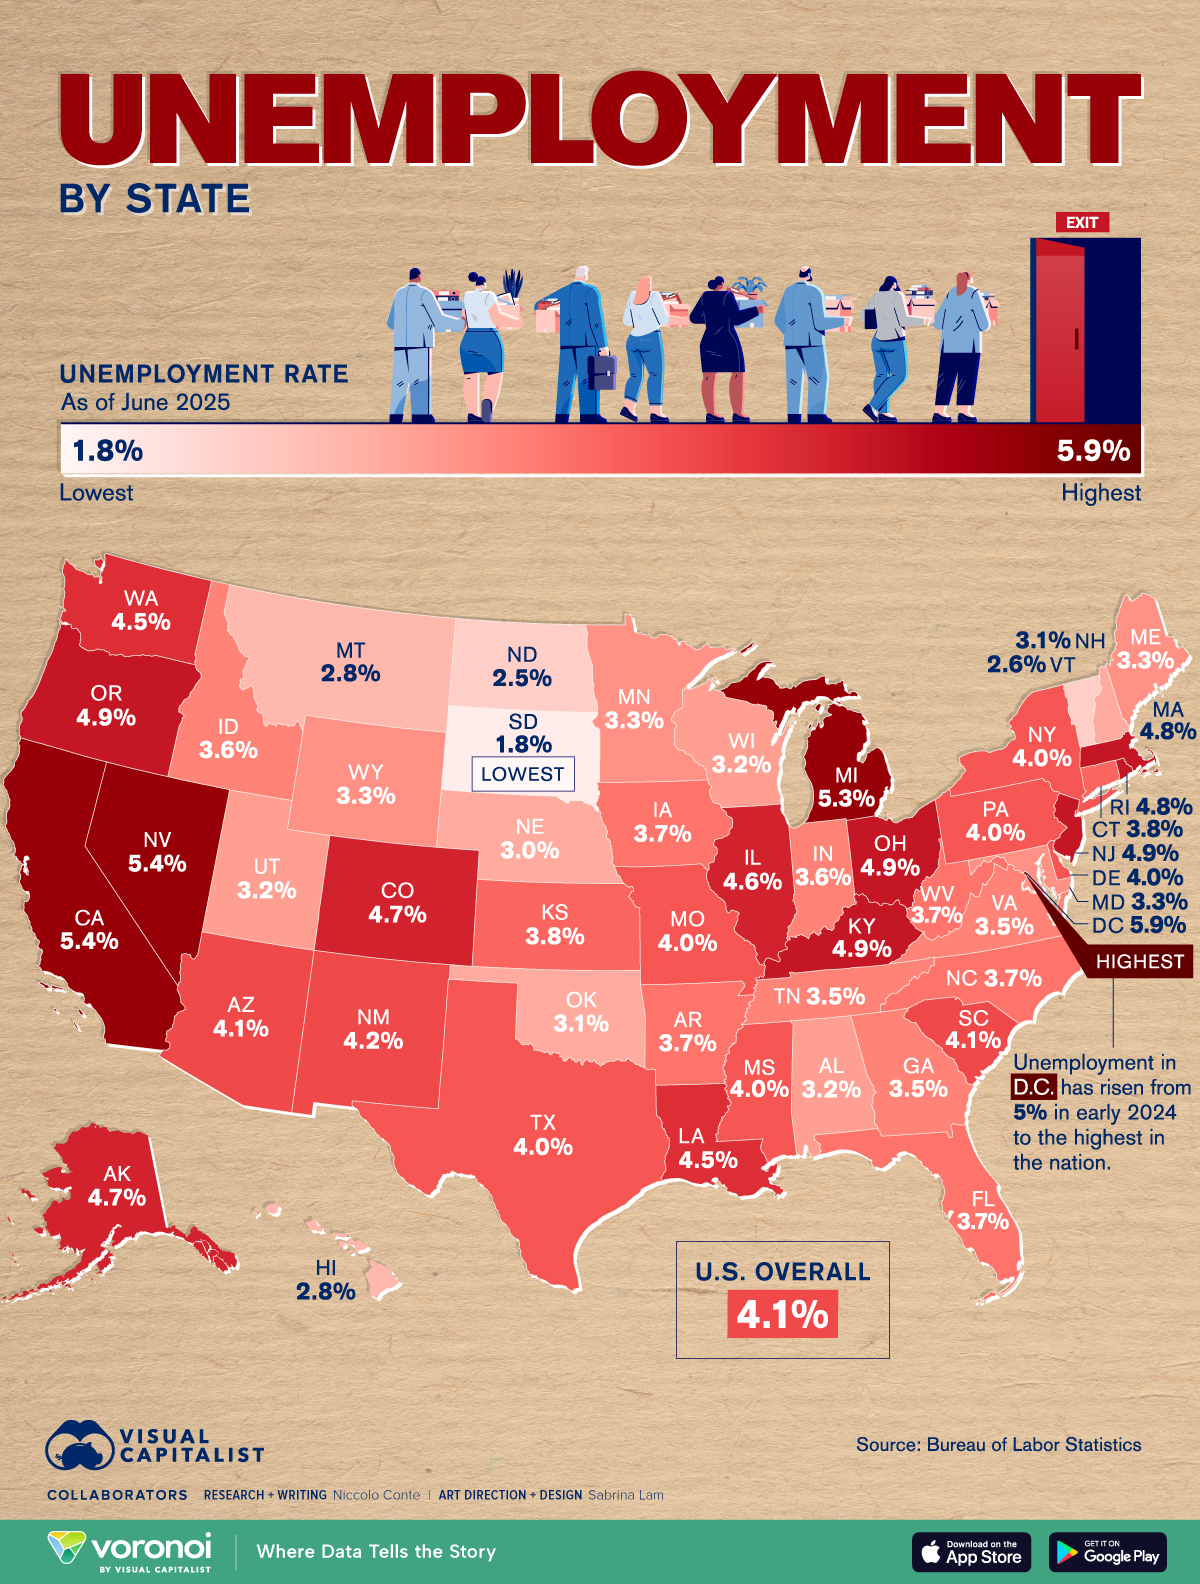
- With the national unemployment rate at 4.1%, South Dakota (1.8%) recorded the lowest unemployment rate in the country.
- Washington D.C. (5.9%) has the highest unemployment rate in the nation, rising sharply from 5.0% in early 2024.
The U.S. labor market remains resilient in 2025, but unemployment figures vary widely by state.
While the national unemployment rate stood at 4.1% in June, some regions are experiencing far higher (or far lower) joblessness.
This visualization highlights the unemployment rate by state using data from the Bureau of Labor Statistics for June 2025.
Washington D.C. Tops Unemployment by State
Washington D.C. tops the list with the highest unemployment rate at 5.9%, as seen in the data table below with the unemployment rate of every U.S. state (and D.C.).
| State | Unemployment Rate (June 2025) |
|---|---|
| District of Columbia | 5.9% |
| California | 5.4% |
| Nevada | 5.4% |
| Michigan | 5.3% |
| Kentucky | 4.9% |
| New Jersey | 4.9% |
| Ohio | 4.9% |
| Oregon | 4.9% |
| Massachusetts | 4.8% |
| Rhode Island | 4.8% |
| Alaska | 4.7% |
| Colorado | 4.7% |
| Illinois | 4.6% |
| Louisiana | 4.5% |
| Washington | 4.5% |
| New Mexico | 4.2% |
| Arizona | 4.1% |
| South Carolina | 4.1% |
| Delaware | 4.0% |
| Mississippi | 4.0% |
| Missouri | 4.0% |
| New York | 4.0% |
| Pennsylvania | 4.0% |
| Texas | 4.0% |
| Connecticut | 3.8% |
| Kansas | 3.8% |
| Arkansas | 3.7% |
| Florida | 3.7% |
| Iowa | 3.7% |
| North Carolina | 3.7% |
| West Virginia | 3.7% |
| Idaho | 3.6% |
| Indiana | 3.6% |
| Georgia | 3.5% |
| Tennessee | 3.5% |
| Virginia | 3.5% |
| Maine | 3.3% |
| Maryland | 3.3% |
| Minnesota | 3.3% |
| Wyoming | 3.3% |
| Alabama | 3.2% |
| Utah | 3.2% |
| Wisconsin | 3.2% |
| New Hampshire | 3.1% |
| Oklahoma | 3.1% |
| Nebraska | 3.0% |
| Hawaii | 2.8% |
| Montana | 2.8% |
| Vermont | 2.6% |
| North Dakota | 2.5% |
| South Dakota | 1.8% |
| United States | 4.1% |
The capital’s high rate marks a significant jump from 5.0% in early 2024, suggesting rising challenges in the capital’s job market amidst Trump’s layoffs across federal agencies.
Nevada (5.4%) and California (5.4%) follow closely behind, reflecting persistent difficulties in sectors like tourism, entertainment, and technology.
Michigan (5.3%) also ranks among the hardest hit, driven by weakness in manufacturing.
The States with the Lowest Unemployment Rates
At the other end of the spectrum, South Dakota recorded the lowest unemployment rate at just 1.8%.
North Dakota (2.5%) and Vermont (2.6%) also reported very low levels of unemployment, underscoring the relative strength of smaller state economies.
Montana and Hawaii, both at 2.8%, round out the bottom five, showing stability even in some tourism-driven markets.
While the U.S. national unemployment rate of 4.1% is slightly above the lows seen during the post-pandemic recovery, the range between the highest and lowest states—more than four percentage points—illustrates the uneven nature of the labor market in America.
Learn More on the Voronoi App ![]()
To learn more about the challenges Americans are facing, check out the graphic on the cost of the American dream on Voronoi, the new app from Visual Capitalist.