![]()
See this visualization first on the Voronoi app.
Use This Visualization
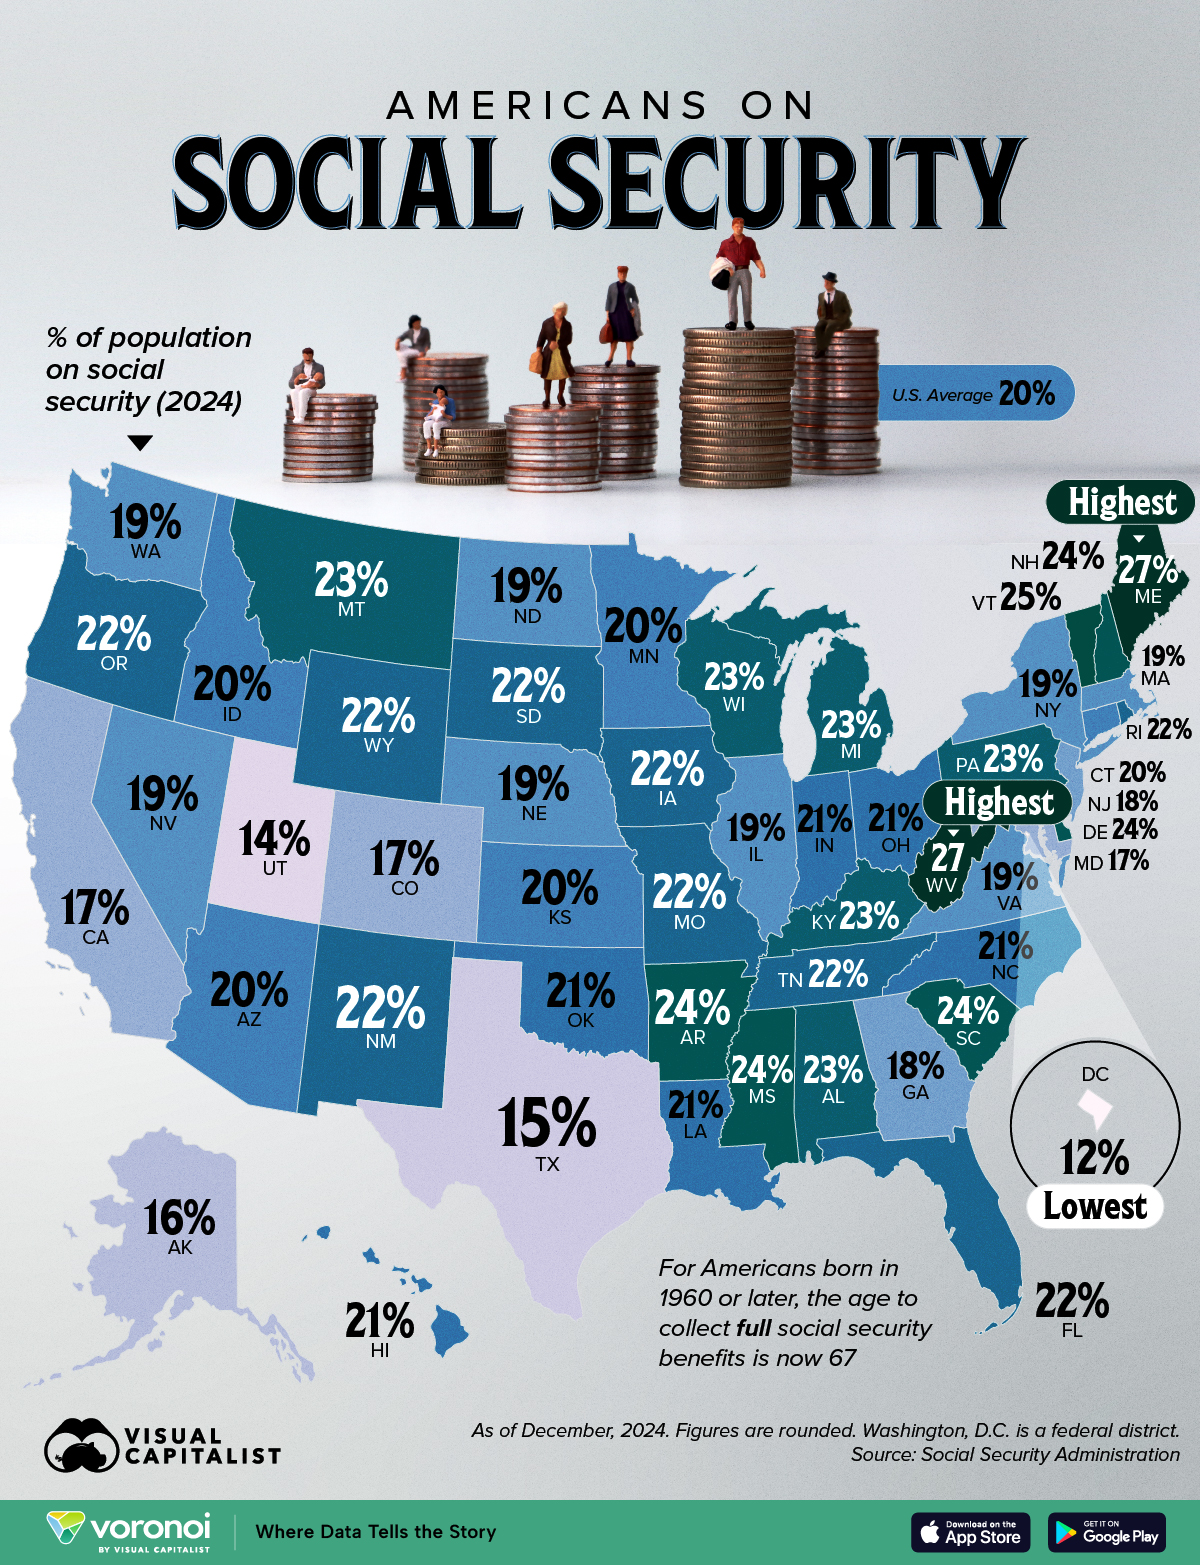
Mapped: Where Americans Receive Social Security, by State
This was originally posted on our Voronoi app. Download the app for free on iOS or Android and discover incredible data-driven charts from a variety of trusted sources.
Key Takeaways
- States with older populations (Maine, West Virginia) naturally have a higher share of Social Security recipients, while younger states (Utah and Texas) have a lower share.
- Florida is an exception: despite having the nation’s second-highest share of seniors, it ranks only 15th by Social Security participation.
Who receives Social Security benefits depends heavily on the age profile of each state.
Migration patterns, labor markets, and lifestyle preferences add further twists.
This map shows the 2024 share of residents in every U.S. state (and D.C.) who collect Social Security retirement, survivor, or disability payments (OASDI).
Further down in this article, the total number of beneficiaries in each jurisdiction is also listed. All figures are rounded.
Data for this visualization comes from the Social Security Administration.
Ranked: Where Americans Receive Social Security, by State
At 27% of their populations, Maine and West Virginia top the list of Social Security beneficiaries, well above the national average of 20%.
This more or less mirrors their share of older adults (aged 65+) in the population.
| Rank | State / Country | State Code | % of Population Receiving Social Security, 2024 | #s on Social Security, 2024 |
|---|---|---|---|---|
| 1 | Maine | ME | 27% | 281K |
| 2 | West Virginia | WV | 27% | 354K |
| 3 | Vermont | VT | 25% | 130K |
| 4 | Arkansas | AR | 24% | 618K |
| 5 | Delaware | DE | 24% | 210K |
| 6 | Mississippi | MS | 24% | 589K |
| 7 | New Hampshire | NH | 24% | 282K |
| 8 | South Carolina | SC | 24% | 1.1M |
| 9 | Alabama | AL | 23% | 1.0M |
| 10 | Kentucky | KY | 23% | 918K |
| 11 | Michigan | MI | 23% | 2.0M |
| 12 | Montana | MT | 23% | 227K |
| 13 | Pennsylvania | PA | 23% | 2.6M |
| 14 | Wisconsin | WI | 23% | 1.2M |
| 15 | Florida | FL | 22% | 4.7M |
| 16 | Iowa | IA | 22% | 648K |
| 17 | Missouri | MO | 22% | 1.2M |
| 18 | New Mexico | NM | 22% | 426K |
| 19 | Oregon | OR | 22% | 854K |
| 20 | Rhode Island | RI | 22% | 222K |
| 21 | South Dakota | SD | 22% | 185K |
| 22 | Tennessee | TN | 22% | 1.4M |
| 23 | Wyoming | WY | 22% | 118K |
| 24 | Hawaii | HI | 21% | 289K |
| 25 | Indiana | IN | 21% | 1.4M |
| 26 | Louisiana | LA | 21% | 920K |
| 27 | North Carolina | NC | 21% | 2.2M |
| 28 | Ohio | OH | 21% | 2.4M |
| 29 | Oklahoma | OK | 21% | 819K |
| 30 | Arizona | AZ | 20% | 1.5M |
| 31 | Connecticut | CT | 20% | 735K |
| 32 | Idaho | ID | 20% | 400K |
| 33 | Kansas | KS | 20% | 594K |
| 34 | Minnesota | MN | 20% | 1.2M |
| 35 | Illinois | IL | 19% | 2.5M |
| 36 | Massachusetts | MA | 19% | 1.4M |
| 37 | Nebraska | NE | 19% | 401K |
| 38 | Nevada | NV | 19% | 653K |
| 39 | New York | NY | 19% | 4.0M |
| 40 | North Dakota | ND | 19% | 159K |
| 41 | Virginia | VA | 19% | 1.8M |
| 42 | Washington | WA | 19% | 1.6M |
| 43 | Georgia | GA | 18% | 2.2M |
| 44 | New Jersey | NJ | 18% | 1.9M |
| 45 | California | CA | 17% | 7.9M |
| 46 | Colorado | CO | 17% | 1.2M |
| 47 | Maryland | MD | 17% | 1.3M |
| 48 | Alaska | AK | 16% | 148K |
| 49 | Texas | TX | 15% | 6.3M |
| 50 | Utah | UT | 14% | 701K |
| 51 | District of Columbia | DC | 12% | 140K |
| N/A | U.S. | US | 20% | 68.0M |
Both Maine and West Virginia have aged rapidly as younger residents move away for work while retirees stay put.
Vermont, also sits above the 25% mark, underscoring how limited in-migration can tilt a state’s demographic balance toward older age groups.
Are Southern States “Senior” States?
Florida’s reputation as a retirement magnet is well earned, yet only 22% of its residents collect Social Security—ranking just 15th nationwide.
The paradox stems from fewer disability beneficiaries compared to Appalachia, and slightly lower uptake among its seniors (about 84% vs. nearly 88% nationally).
South Carolina (24%) and North Carolina (21%) show that the wider South is becoming a popular destination for older Americans seeking warmer weather and lower living costs.
The U.S. States With Room to Age
Utah (14%), Texas (15%), and Alaska (16%) have the lowest shares of Social Security recipients.
High birth rates, booming job markets, and youthful in-migration swell the denominator of working-age residents. That keeps the share of Social Security recipients low—even as these states will eventually face the same aging pressures as the rest of the country.
While this eases immediate fiscal pressure, these states will eventually face the same demographic headwinds as the U.S. population’s median age continues to tick up.
Learn More on the Voronoi App ![]()
If you enjoyed today’s post, check out Mapped: U.S. Poverty Rates by State on Voronoi, the new app from Visual Capitalist.