Published
54 minutes ago
on
September 26, 2025
| 26 views
-->
By
Julia Wendling
Graphics & Design
- Zack Aboulazm
- Lebon Siu
Which U.S. Cities Saw Record-Breaking Temperatures in 2024?
Global temperatures are climbing—but how is this trend playing out across the United States, and which regions are being hit the hardest?
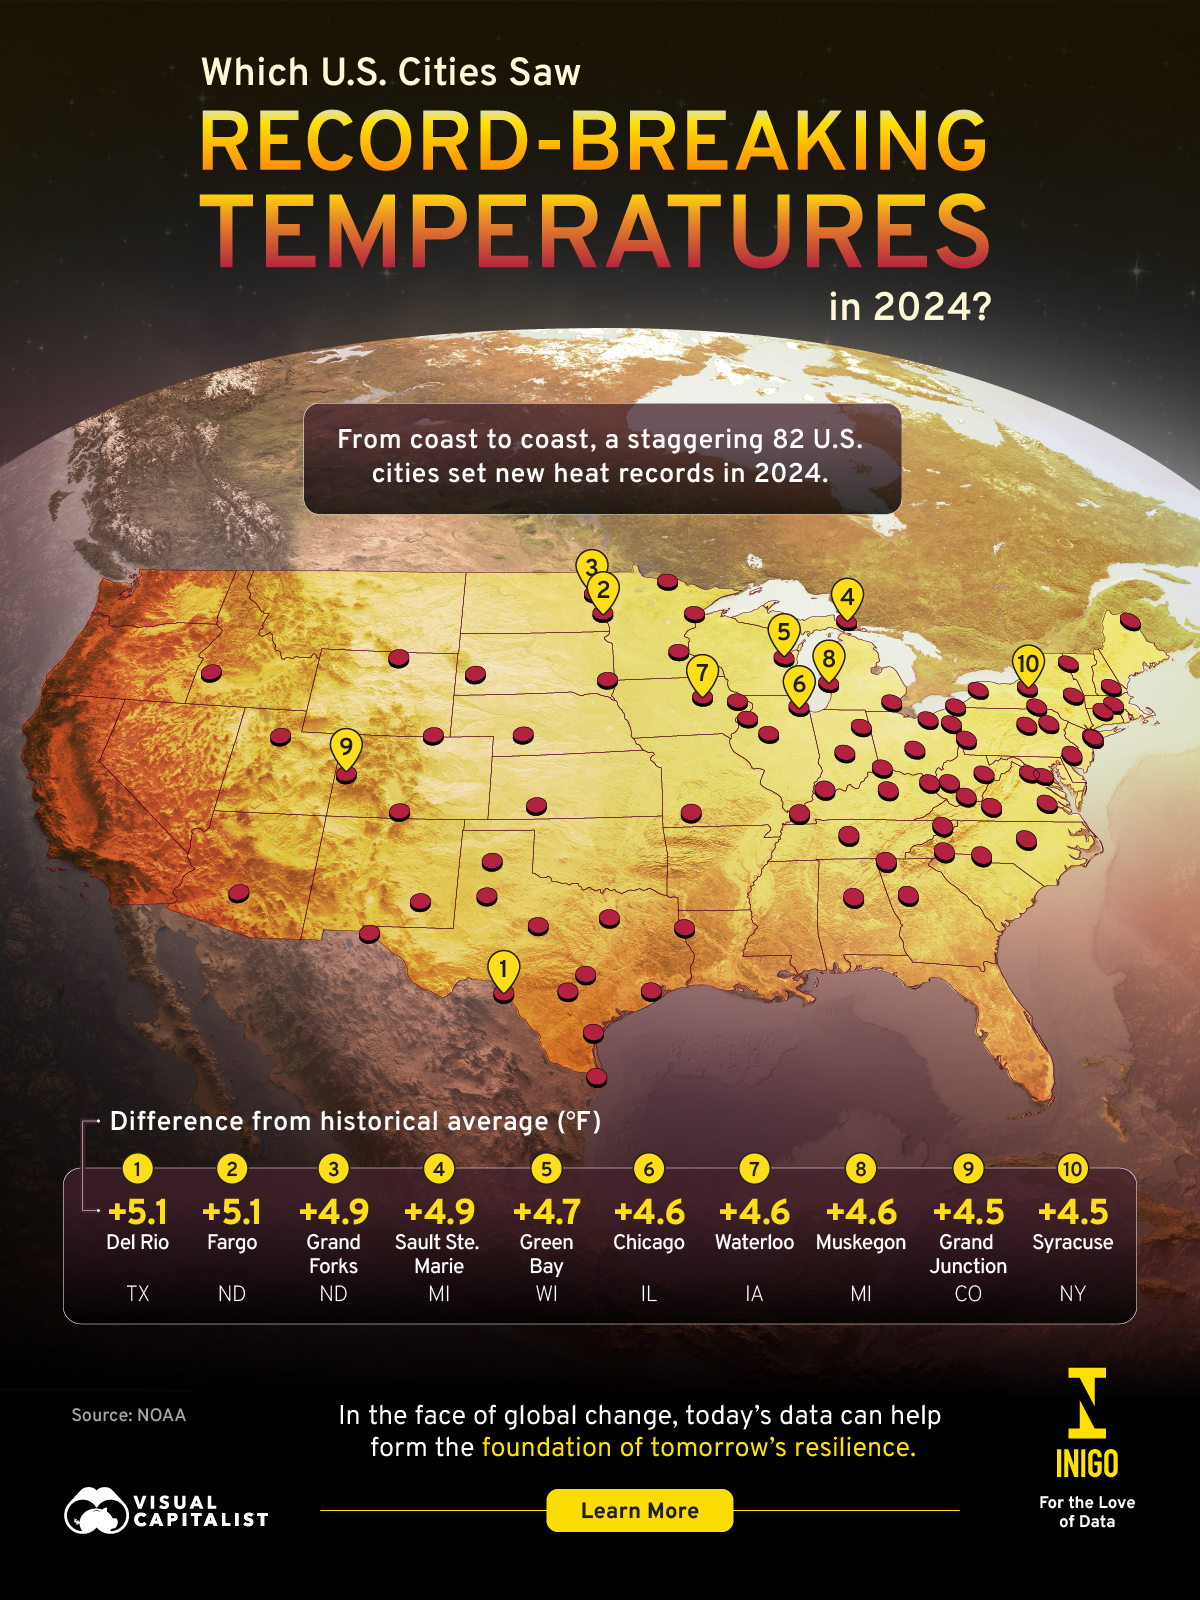
This visualization, developed in partnership with Inigo, highlights the U.S. cities that recorded record-breaking average temperatures in 2024. The data comes from the NOAA National Centers for Environmental Information and provides clear context on where the heat is intensifying the most.
Climbing Temperatures
According to the NOAA National Centers for Environmental Information’s annual report, 2024 was the warmest year on record since global measurements began in 1850. In the contiguous United States, it was also the hottest year in the 130-year record, with an average temperature of 55.5°F—3.5°F above the long-term norm.
Why are global temperatures climbing? The primary driver is human-induced climate change, fueled by the excessive burning of fossil fuels. This process releases heat-trapping greenhouse gases into the atmosphere, intensifying the planet’s warming.
As populations expand and industrialization advances, the upward trend in temperatures is likely to continue—unless significant, coordinated efforts are made to transition toward renewable energy and reduce overall consumption.
Cities with Hottest Temperatures Across the U.S.
The national average hit record highs in 2024, but the heat did not spread evenly across the country.
Eighty-two U.S. cities set new all-time temperature records, with most located in the North and Northeast—regions not usually known for extreme heat.
| City, State | Avg. Temp. 2024 | Avg. Temp. 1991-2020 | Delta |
|---|---|---|---|
| Del Rio, TX | 76.4 | 71.3 | 5.1 |
| Fargo, ND | 47.7 | 42.6 | 5.1 |
| Sault Ste. Marie, MI | 47 | 42.1 | 4.9 |
| Grand Forks, ND | 45.4 | 40.5 | 4.9 |
| Green Bay, WI | 50.3 | 45.6 | 4.7 |
| Chicago, IL | 55.1 | 50.5 | 4.6 |
| Waterloo, IA | 52.5 | 47.9 | 4.6 |
| Muskegon, MI | 53.3 | 48.7 | 4.6 |
| Grand Junction, CO | 57.8 | 53.3 | 4.5 |
| Syracuse, NY | 53.4 | 48.9 | 4.5 |
| Duluth, MN | 44.7 | 40.3 | 4.4 |
| Pittsburgh, PA | 56.5 | 52.1 | 4.4 |
| International Falls, MN | 42.3 | 37.9 | 4.4 |
| Caribou, ME | 44.8 | 40.5 | 4.3 |
| Burlington, VT | 51.1 | 46.9 | 4.2 |
| St Paul, MN | 51 | 46.8 | 4.2 |
| Milwaukee, WI | 52.9 | 48.7 | 4.2 |
| Buffalo, NY | 53.1 | 49 | 4.1 |
| Sioux Falls, SD | 50.6 | 46.5 | 4.1 |
| Shreveport, LA | 70.6 | 66.6 | 4 |
| Huntington, WV | 60.3 | 56.3 | 4 |
| El Paso, TX | 69.9 | 66 | 3.9 |
| Peoria, IL | 56.3 | 52.4 | 3.9 |
| Hartford, CT | 55.1 | 51.2 | 3.9 |
| Erie, PA | 54.4 | 50.5 | 3.9 |
| Dubuque, IA | 51.4 | 47.5 | 3.9 |
| Roswell, NM | 65.9 | 62.1 | 3.8 |
| Amarillo, TX | 62 | 58.2 | 3.8 |
| Lexington, KY | 59.9 | 56.1 | 3.8 |
| Cleveland, OH | 55.3 | 51.5 | 3.8 |
| Albany, NY | 52.8 | 49.1 | 3.7 |
| Columbus, OH | 57.4 | 53.8 | 3.6 |
| Salt Lake City, UT | 57.4 | 53.8 | 3.6 |
| Youngstown, OH | 53.5 | 49.9 | 3.6 |
| Abilene, TX | 68.8 | 65.2 | 3.6 |
| Raleigh, NC | 64.5 | 61 | 3.5 |
| Fort Wayne, IN | 54.5 | 51 | 3.5 |
| Detroit, MI | 54.2 | 50.8 | 3.4 |
| Worcester, MA | 51.8 | 48.4 | 3.4 |
| Sheridan, WY | 49.1 | 45.7 | 3.4 |
| Brownsville, TX | 78.5 | 75.2 | 3.3 |
| Nashville, TN | 63.8 | 60.5 | 3.3 |
| Paducah, KY | 61.8 | 58.5 | 3.3 |
| Evansville, IN | 60.4 | 57.1 | 3.3 |
| Cincinnati, OH | 58 | 54.7 | 3.3 |
| Moline, IL | 54.4 | 51.1 | 3.3 |
| Elkins, WV | 54.3 | 51 | 3.3 |
| Rapid City, SD | 50.4 | 47.1 | 3.3 |
| Houston, TX | 74.3 | 71.1 | 3.2 |
| Indianapolis, IN | 57 | 53.8 | 3.2 |
| Washington (Dulles), DC | 58.9 | 55.7 | 3.2 |
| Wilkes-Barre, PA | 53.8 | 50.6 | 3.2 |
| Binghamton, NY | 50 | 46.9 | 3.1 |
| San Antonio, TX | 73.3 | 70.2 | 3.1 |
| Phoenix, AZ | 78.6 | 75.6 | 3 |
| Corpus Christi, TX | 75.9 | 72.9 | 3 |
| Lubbock, TX | 64.3 | 61.3 | 3 |
| Austin, TX | 72.9 | 70 | 2.9 |
| Atlanta, GA | 66.3 | 63.4 | 2.9 |
| Washington (Reagan National), DC | 61.9 | 59 | 2.9 |
| Springfield, MO | 59.8 | 56.9 | 2.9 |
| Charleston, WV | 59 | 56.1 | 2.9 |
| Williamsport, PA | 54.4 | 51.5 | 2.9 |
| Dodge City, KS | 58.6 | 55.8 | 2.8 |
| Chattanooga, TN | 64.6 | 61.8 | 2.8 |
| Roanoke, VA | 60.5 | 57.7 | 2.8 |
| Beckley, WV | 55.3 | 52.5 | 2.8 |
| North Platte, NE | 52.3 | 49.5 | 2.8 |
| Concord, NH | 49.7 | 47 | 2.7 |
| Charlotte, NC | 64.1 | 61.4 | 2.7 |
| Asheville, NC | 59.3 | 56.6 | 2.7 |
| Birmingham, AL | 66.4 | 63.8 | 2.6 |
| Alamosa, CO | 44.8 | 42.3 | 2.5 |
| Richmond, VA | 61.8 | 59.4 | 2.4 |
| New York (JFK), NY | 57.3 | 54.9 | 2.4 |
| Cheyenne, WY | 49.3 | 46.9 | 2.4 |
| San Juan, PR | 83.3 | 80.9 | 2.4 |
| Dallas, TX | 70.2 | 67.9 | 2.3 |
| Philadelphia, PA | 59 | 56.7 | 2.3 |
| New York (Central Park), NY | 58 | 55.7 | 2.3 |
| Boise, ID | 55.4 | 53.1 | 2.3 |
| Johnson City, TN | 58.9 | 56.7 | 2.2 |
Several cities stood out with the largest jumps above their long-term averages:
- Del Rio, TX: 5.1°F above average
- Fargo, ND: 5.1°F above average
- Sault Ste. Marie, MI: 4.9°F above average
- Grand Forks, ND: 4.9°F above average
- Green Bay, WI: 4.7°F above average
The Future of Climate Change
As the globe continues to warm, record-breaking temperatures will likely rise in frequency. These shifts will drive serious consequences, including altered weather patterns and more severe natural disasters.
![]()
Explore Inigo’s Hub.
You may also like
-
Technology2 months ago
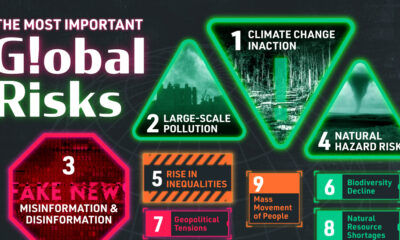
Ranked: The 28 Biggest Global Risks, According to the UN
Climate change inaction was the most important risk overall, ranking as the most pressing issue in three of the seven regions.
-
Misc3 months ago
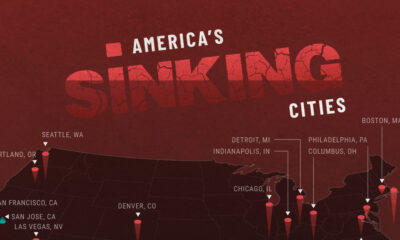
Mapped: America’s Sinking Cities
25 of the 28 largest U.S. metropolitan areas are sinking each year, with cities in Texas experiencing some of the most severe land subsidence.
-
Green5 months ago
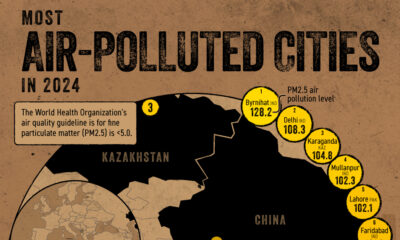
Mapped: Most Air-Polluted Cities in the World
India is home to many of the world’s most air-polluted cities, accounting for 11 of the top 20 cities in 2024.
-

Environment6 months ago
Charted: The Longest-Living Animals on Earth
Earth’s longest-lived animal can survive for over 10,000 years.
-
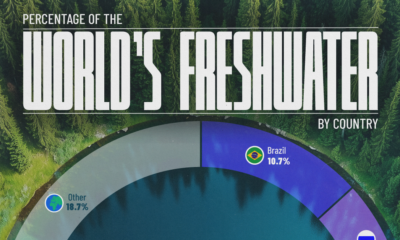
Green6 months ago
Charted: Share of Freshwater Resources by Country
Water is a scarce commodity that is likely to fuel future conflict. View our graphic to see who controls the most freshwater resources.
-
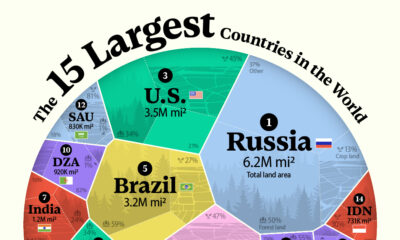
Misc8 months ago
Ranked: The 15 Largest Countries in the World by Land Area
Ranking the top 15 by land area instead of total area produces some interesting results. Read why here.
Subscribe
Please enable JavaScript in your browser to complete this form.Join 375,000+ email subscribers: *Sign Up