![]()
See more visualizations like this on the Voronoi app.
Use This Visualization
Mapped: Extreme Poverty in America by State
See visuals like this from many other data creators on our Voronoi app. Download it for free on iOS or Android and discover incredible data-driven charts from a variety of trusted sources.
Key Takeaways
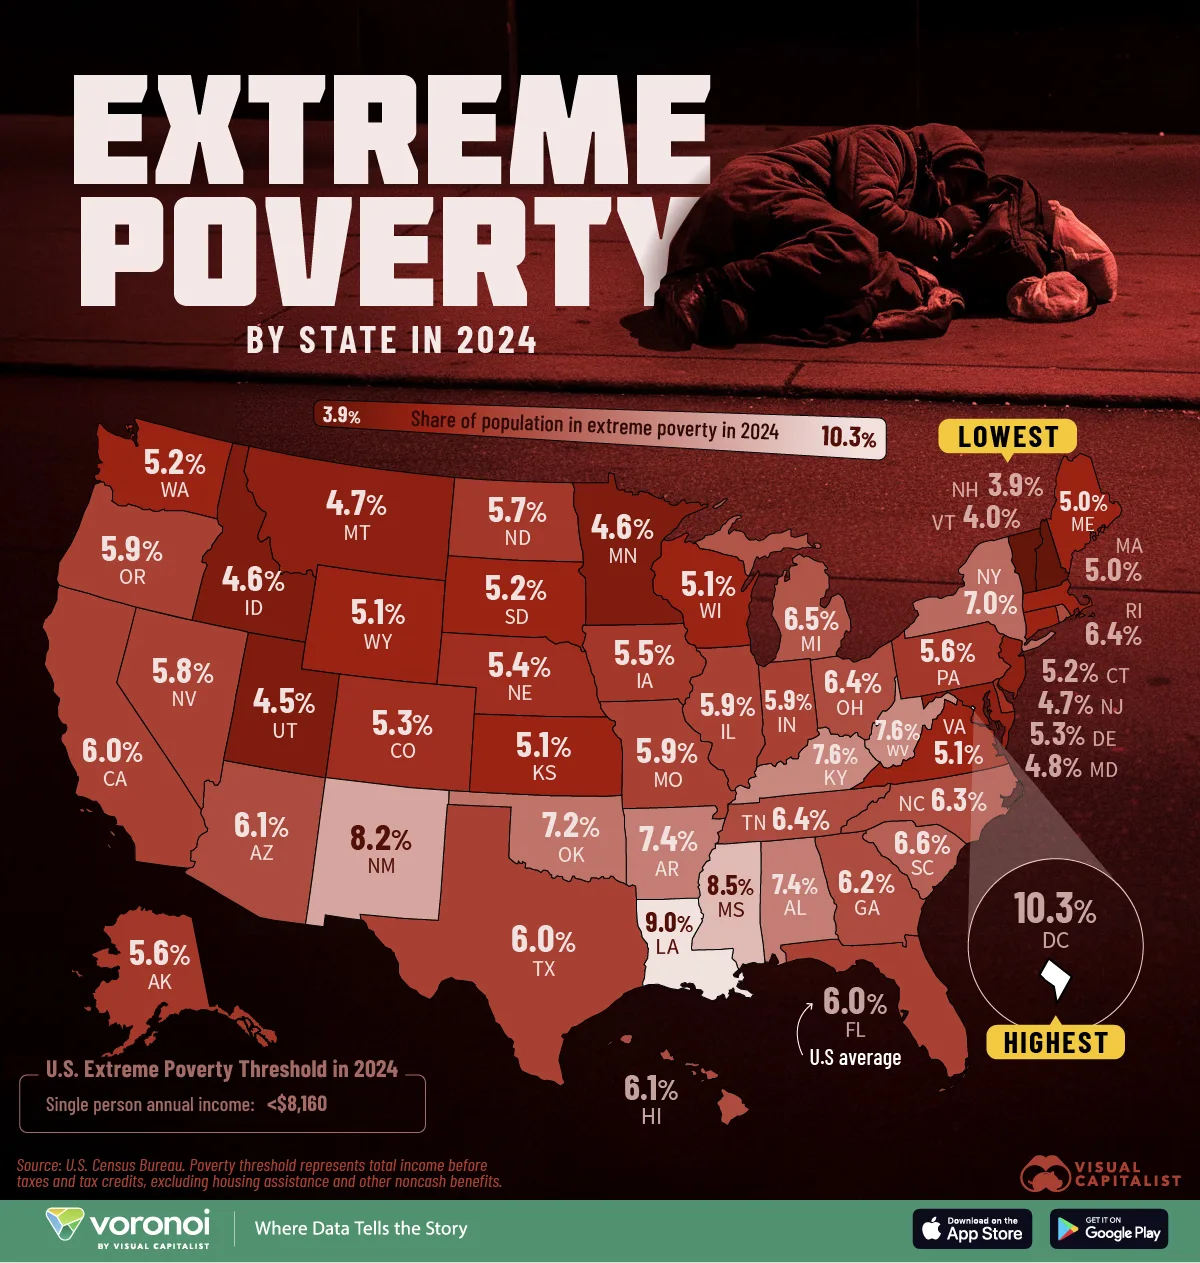
- Millions of Americans are extremely impoverished, with Washington D.C. seeing 10.3% of its population earning $8,160 or less in 2024, the highest rate in the country.
- Louisiana (9%), Mississippi (8.5%), and New Mexico (8.2%) fall next in line, compounded by low wages and comparatively limited economic opportunity compared to other states.
In 2024, 6% of the U.S. population lived in extreme poverty, equal to 20.4 million people.
While there are different definitions of extreme poverty, this is represented as those earning less than $8,160 in annual income, or half of the poverty line. As the federal budget makes cuts to food assistance and healthcare, levels of extreme poverty run the risk of worsening even further.
This graphic shows the share of each state living in extreme poverty in 2024, based on data from the U.S. Census Bureau.
Washington D.C. Has the Highest Level of Extreme Poverty
Last year, more than one in 10 residents of the nation’s capital lived in extreme poverty.
| State | Share of Population Living in Extreme Poverty in 2024 |
|---|---|
| District of Columbia | 10.3% |
| Louisiana | 9.0% |
| Mississippi | 8.5% |
| New Mexico | 8.2% |
| Kentucky | 7.6% |
| West Virginia | 7.6% |
| Alabama | 7.4% |
| Arkansas | 7.4% |
| Oklahoma | 7.2% |
| New York | 7.0% |
| South Carolina | 6.6% |
| Michigan | 6.5% |
| Ohio | 6.4% |
| Tennessee | 6.4% |
| Rhode Island | 6.4% |
| North Carolina | 6.3% |
| Georgia | 6.2% |
| Arizona | 6.1% |
| Hawaii | 6.1% |
| Texas | 6.0% |
| United States | 6.0% |
| California | 6.0% |
| Florida | 6.0% |
| Illinois | 5.9% |
| Indiana | 5.9% |
| Missouri | 5.9% |
| Oregon | 5.9% |
| Nevada | 5.8% |
| North Dakota | 5.7% |
| Pennsylvania | 5.6% |
| Alaska | 5.6% |
| Iowa | 5.5% |
| Nebraska | 5.4% |
| Colorado | 5.3% |
| Delaware | 5.3% |
| Washington | 5.2% |
| Connecticut | 5.2% |
| South Dakota | 5.2% |
| Virginia | 5.1% |
| Wisconsin | 5.1% |
| Kansas | 5.1% |
| Wyoming | 5.1% |
| Massachusetts | 5.0% |
| Maine | 5.0% |
| Maryland | 4.8% |
| New Jersey | 4.7% |
| Montana | 4.7% |
| Minnesota | 4.6% |
| Idaho | 4.6% |
| Utah | 4.5% |
| Vermont | 4.0% |
| New Hampshire | 3.9% |
Extreme poverty threshold represents total income before taxes and tax credits, excluding housing assistance and other noncash benefits.
Going further, economic hardship disproportionately impacts people of color in Washington D.C., with one in three black children living in poverty between 2019 and 2023, on average.
As we can see, Southern states also rank among the most impoverished. In Louisiana, 9% of residents live in extreme poverty, and on average, 18.9% lived below the poverty line between 2021 and 2023.
Meanwhile, 7% of New York’s population are extremely impoverished, equal to an estimated 1.4 million people.
On the other end of the spectrum is New Hampshire with the lowest rate nationally, at 3.9%. The Granite State benefits from a stable job market, low unemployment, and a strong education system. Paired with relatively affordable healthcare, these factors contribute to higher living standards for its residents, reducing the risk of poverty.
Learn More on the Voronoi App ![]()
To learn more about this topic, check out this graphic on the world’s poorest countries by GDP per capita.