![]()
See more visuals like this on the Voronoi app.
Use This Visualization
Mapped: Greenest Cities in America in 2025
See visuals like this from many other data creators on our Voronoi app. Download it for free on iOS or Android and discover incredible data-driven charts from a variety of trusted sources.
Key Takeaways
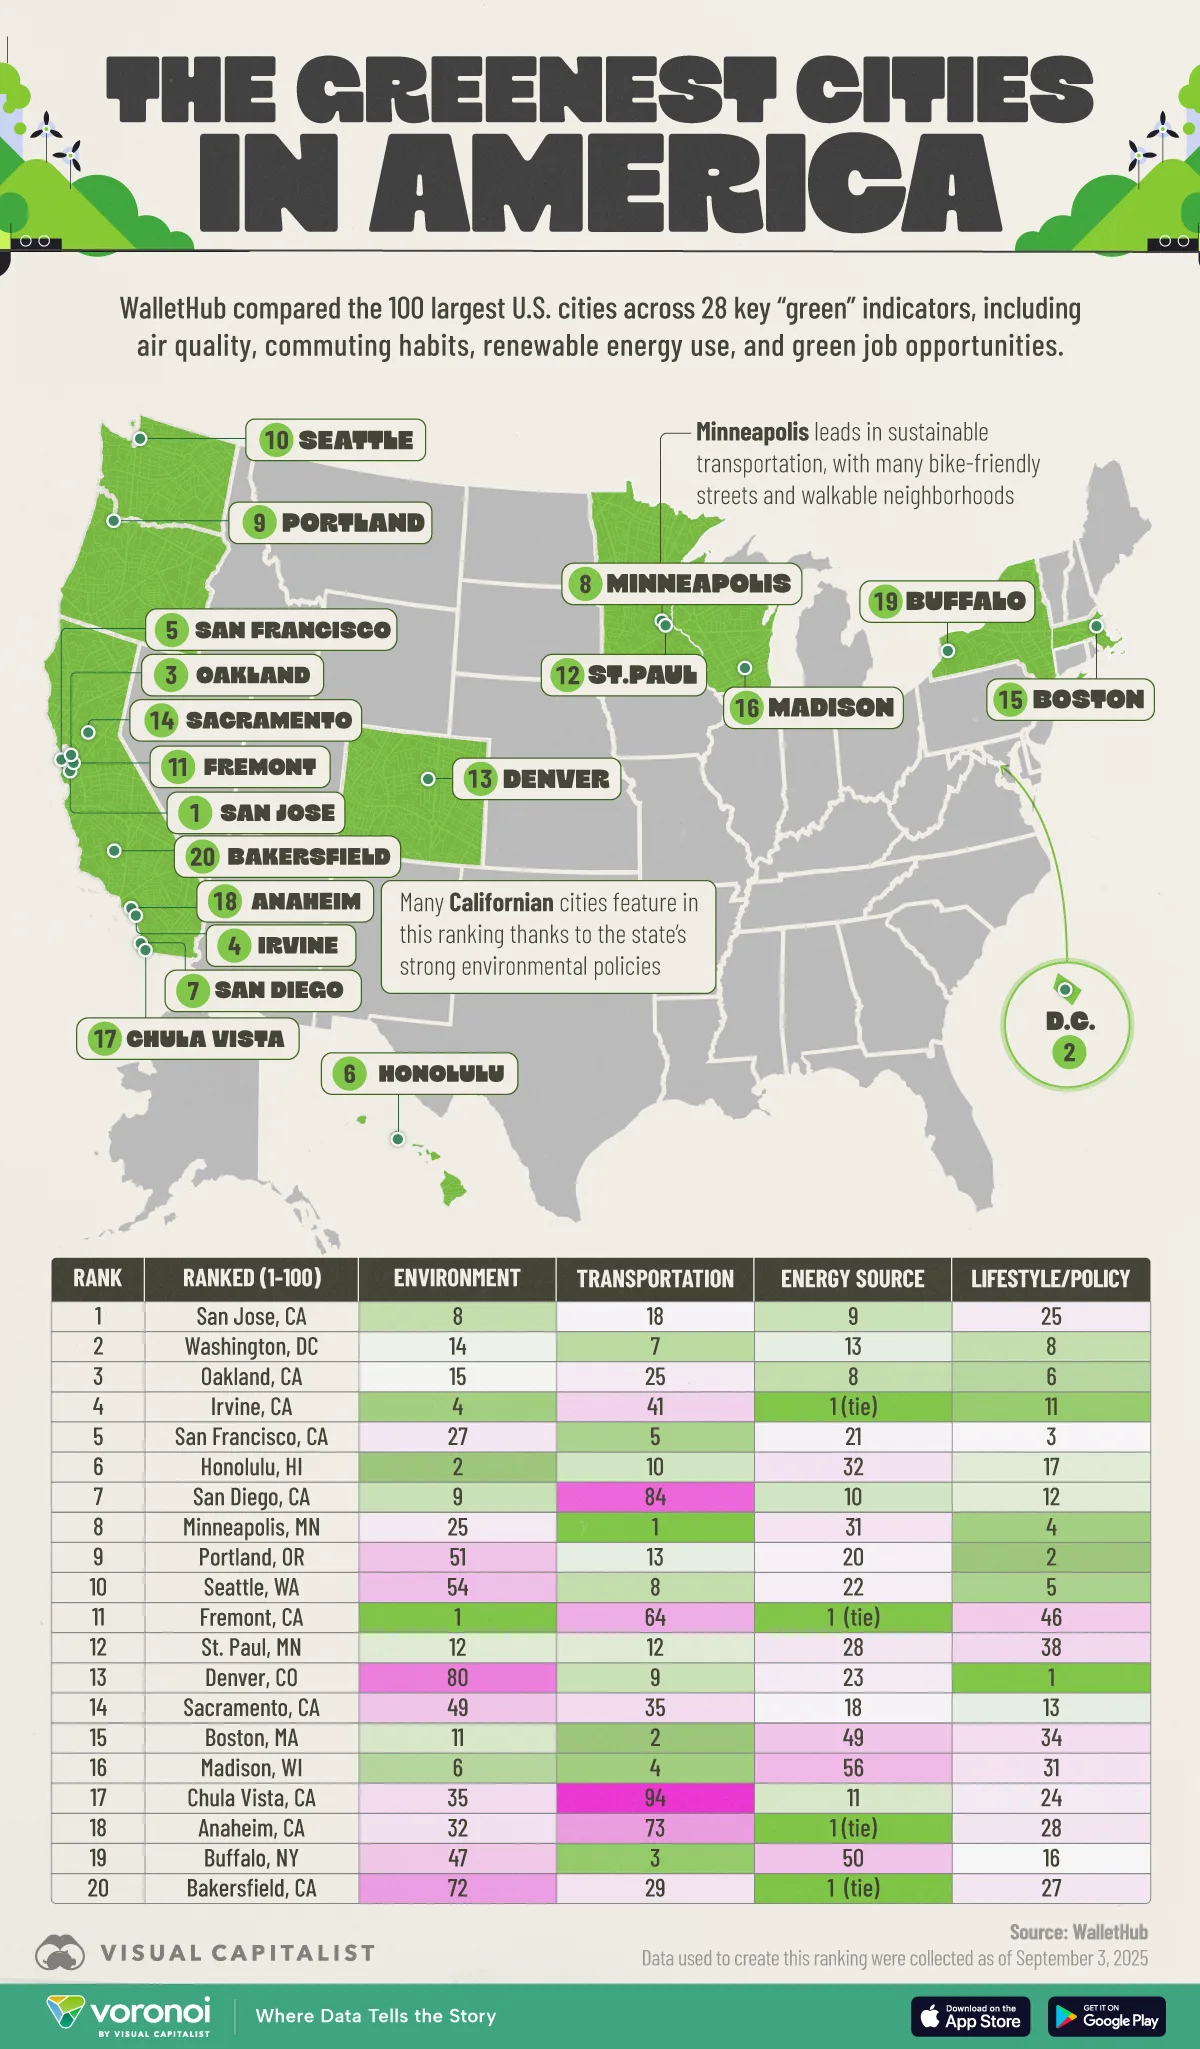
- WalletHub compared the 100 largest U.S. cities across 28 key “green” indicators, including air quality, commuting habits, renewable energy use, and green job opportunities.
- San Jose, CA ranks #1 overall with a total score of 69.44, narrowly edging out Washington, DC (69.26).
- With strong environmental policies, California leads with eight of the 20 greenest cities.
- Minneapolis leads in sustainable transportation, supported by bike-friendly streets and walkable neighborhoods.
America’s greenest cities are becoming cleaner, more sustainable, and increasingly urbanized.
This map ranks the 100 largest U.S. cities by their environmental performance across four key categories: environment, transportation, energy sources, and lifestyle and policy. The data for this visualization comes from WalletHub.
California’s Dominance in Urban Sustainability
California continues to lead the way in green urban planning.
Eight of the top 20 cities in the 2025 ranking are in California, including San Jose (#1), Oakland (#3), Irvine (#4), and San Francisco (#5). These cities have implemented ambitious emissions goals, renewable energy programs, and infrastructure investments to reduce reliance on cars.
| Ranked (1-100) | City | Environment | Transportation | Energy Sources | Lifestyle & Policy |
|---|---|---|---|---|---|
| 1 | San Jose, CA | 8 | 18 | 9 | 25 |
| 2 | Washington, DC | 14 | 7 | 13 | 8 |
| 3 | Oakland, CA | 15 | 25 | 8 | 6 |
| 4 | Irvine, CA | 4 | 41 | 1 | 11 |
| 5 | San Francisco, CA | 27 | 5 | 21 | 3 |
| 6 | Honolulu, HI | 2 | 10 | 32 | 17 |
| 7 | San Diego, CA | 9 | 84 | 10 | 12 |
| 8 | Minneapolis, MN | 25 | 1 | 31 | 4 |
| 9 | Portland, OR | 51 | 13 | 20 | 2 |
| 10 | Seattle, WA | 54 | 8 | 22 | 5 |
| 11 | Fremont, CA | 1 | 64 | 1 | 46 |
| 12 | St. Paul, MN | 12 | 12 | 28 | 38 |
| 13 | Denver, CO | 80 | 9 | 23 | 1 |
| 14 | Sacramento, CA | 49 | 35 | 18 | 13 |
| 15 | Boston, MA | 11 | 2 | 49 | 34 |
| 16 | Madison, WI | 6 | 4 | 56 | 31 |
| 17 | Chula Vista, CA | 35 | 94 | 11 | 24 |
| 18 | Anaheim, CA | 32 | 73 | 1 | 28 |
| 19 | Buffalo, NY | 47 | 3 | 50 | 16 |
| 20 | Bakersfield, CA | 72 | 29 | 1 | 27 |
Statewide, California is pushing toward carbon neutrality by 2045, aiming to cut emissions 40% below 1990 levels by 2030. It also plans for 100% zero-emission new car sales by 2035 and 100% clean electricity by 2045, with 60% renewable power by 2030.
Transportation Leaders in the Midwest
Minneapolis (#8) and St. Paul (#12) stand out for their transportation infrastructure. Minneapolis ranks first in the transportation category, supported by extensive bike lanes, pedestrian-friendly design, and efficient public transit options.
Washington, DC performs particularly well in lifestyle and policy measures, ranking 8th in that category. Honolulu (#6) and Portland (#9) also make the top 10.
Learn More on the Voronoi App ![]()
If you enjoyed today’s post, check out Mapped: Where the Air Quality is Best in Each U.S. State on Voronoi, the new app from Visual Capitalist.