Published
14 minutes ago
on
October 27, 2025
| 13 views
-->
By
Jenna Ross
Graphics & Design
- Zack Aboulazm
The following content is sponsored by Terzo
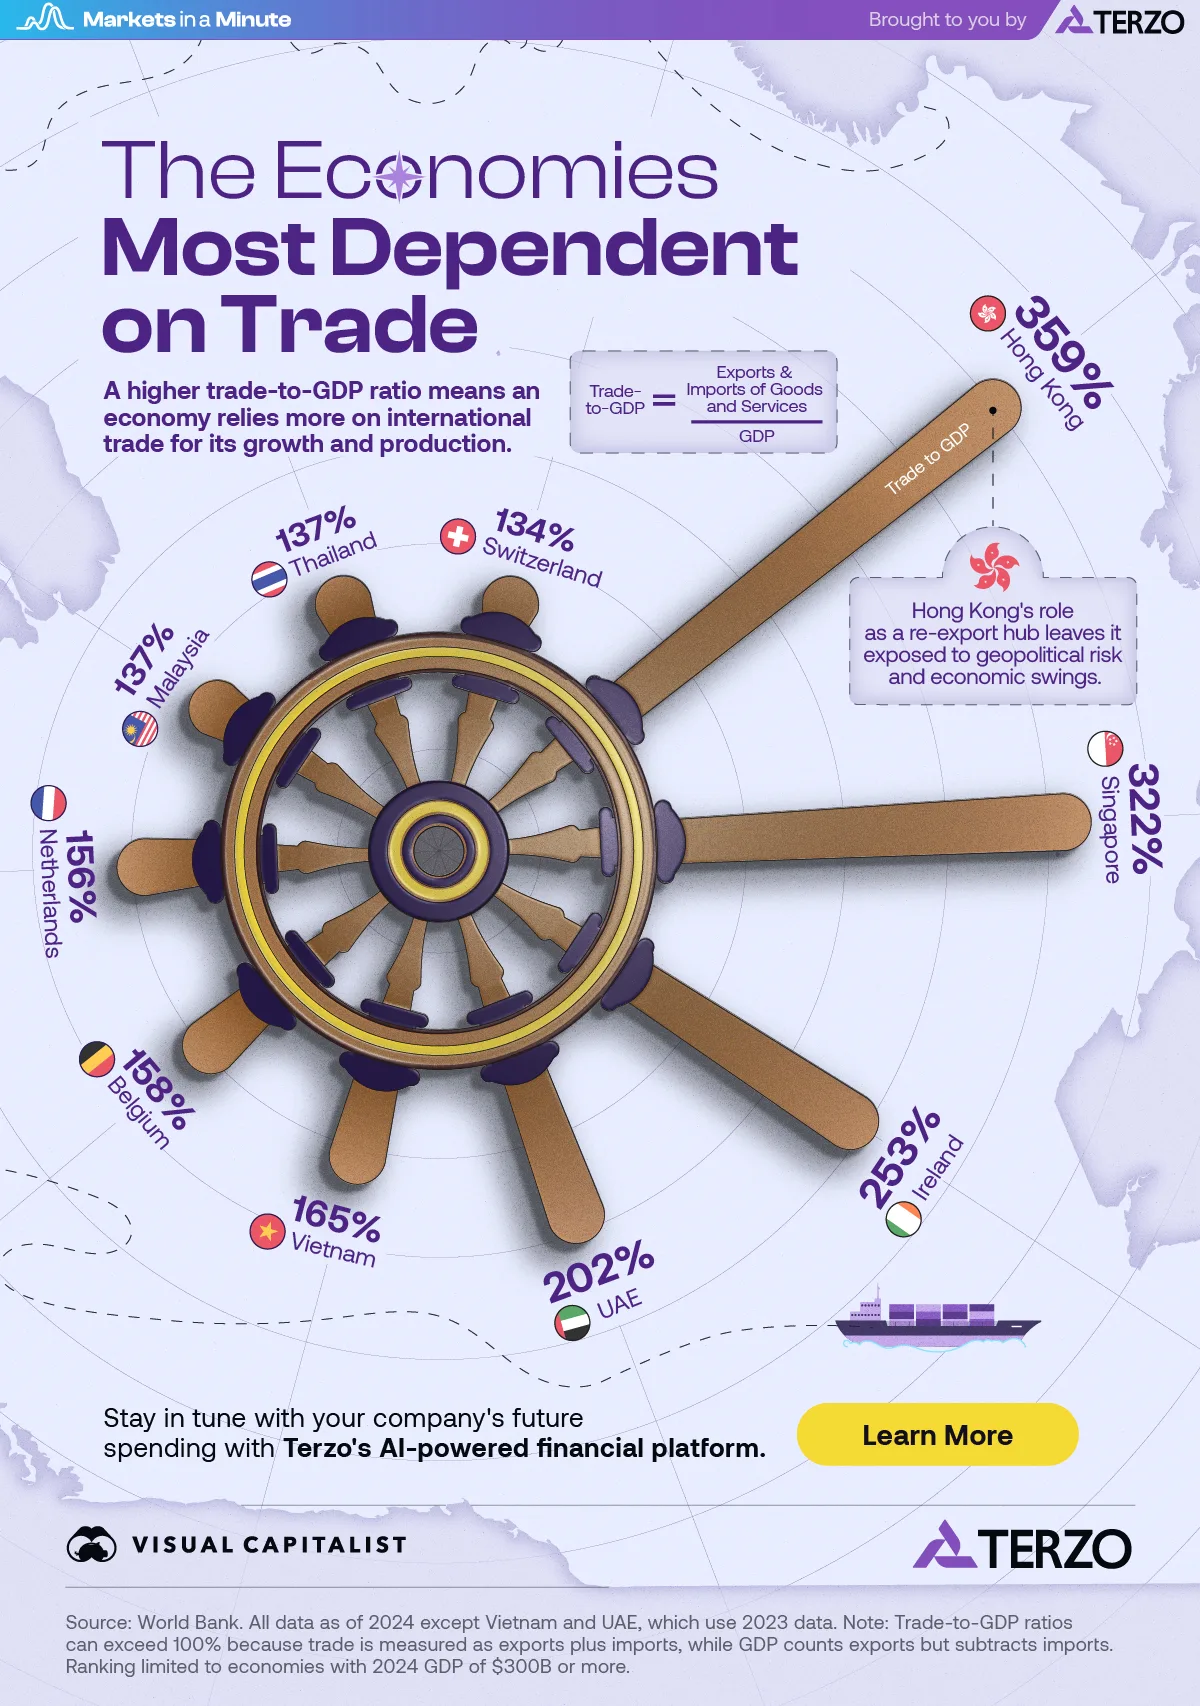
The Economies Most Dependent on International Trade
Key Takeaways
- A higher trade-to-GDP ratio means an economy relies more on international trade.
- Hong Kong has the highest ratio because it acts as a re-export hub, primarily between Mainland China and the rest of the world.
Fueled by tariffs, the trade war has threatened economic ties in 2025. But which economies are most exposed to these shifts in international trade?
This graphic was created in partnership with Terzo for our Markets in a Minute series, which features quick economic insights for executives. We explore which countries and jurisdictions rely the most on trade to power their economies.
The Biggest International Trade Dependencies
A key measure of how much an economy depends on international trade is the trade-to-GDP ratio. The ratio is the total of a country’s exports and imports of goods and services, divided by its GDP.
Importantly, a higher ratio means a country’s growth, production, and value chains are more entwined with global flows. As a result, changes in tariffs and trade wars can have a bigger impact.
Here is a table that shows economies with the highest ratios. We’ve limited our ranking to jurisdictions with a 2024 GDP of $300 billion or more.
| Economy | Trade-to-GDP Ratio |
|---|---|
| Hong Kong | 359% |
| Singapore | 322% |
| Ireland | 253% |
| United Arab Emirates | 202% |
| Vietnam | 165% |
| Belgium | 158% |
| Netherlands | 156% |
| Malaysia | 137% |
| Thailand | 137% |
| Switzerland | 134% |
Source: World Bank. Note: Trade-to-GDP ratios can exceed 100% because trade is measured as exports plus imports, while GDP counts exports but subtracts imports.
Hong Kong has the highest ratio of over 350%, meaning trade flows through the area are more than three times the size of its economy. Due to its free trade policies, Hong Kong acts as a re-export hub, particularly between Mainland China and the rest of the world.
Singapore ranks second in international trade dependency. The city-state’s strategic location, strong logistics infrastructure, and global market connections have established its role as a main trading hub.
When it comes to U.S. tariffs, some trade-dependent countries have been hit harder than others. Imports from Vietnam, Thailand, and Switzerland are all set to generate some of the highest tariff revenues for America.
Reacting to the Trade War
Given the high exposure to geopolitical shifts and tariffs, how do these economies plan to stay resilient?Industry experts say Hong Kong must evolve from a simple re-export hub to a supply chain services manager by offering support in areas like finance, law, and insurance. Hong Kong also plans to build up its airport infrastructure as another competitive advantage amid the trade war.
Meanwhile, Ireland is looking to mitigate U.S. tariffs by offering companies grants and other support to look into new market opportunities outside the U.S.
![]()
Stay in tune with your company’s spending, revenue, and risk with Terzo’s AI-powered financial platform.
More from Terzo
-
Economy7 days ago
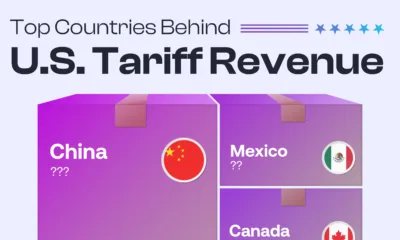
Top Countries Behind U.S. Tariff Revenue
Tariff rates vary by country, as does the value of goods each nation exports to the U.S. Which countries contribute the most?
-

Business2 weeks ago
Industries Hiring and Firing the Most Employees
As the U.S. labor market cools, which industries are still hiring—and which are cutting back their workforces?
-
Markets4 weeks ago
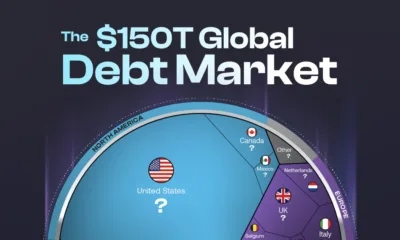
The $150T Global Debt Market
Global debt continues to climb, reaching $150T in Q1 2025. Which countries carry the heaviest burdens?
-
Money1 month ago
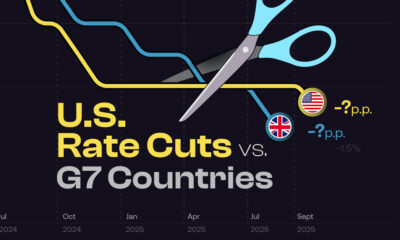
NEW: Fed Rate Cuts vs. Other G7 Countries
How do Fed rate cuts in the U.S. compare with the interest rate changes in other G7 countries, and what does it mean for business?
-
Jobs2 months ago
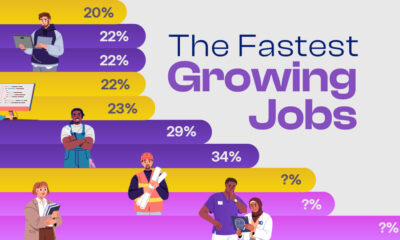
Ranked: The Fastest Growing Jobs (2024-2034)
Explore the fastest growing jobs by projected growth rate, plus salary insights, in a rapidly changing job market.
-
Investor Education2 months ago
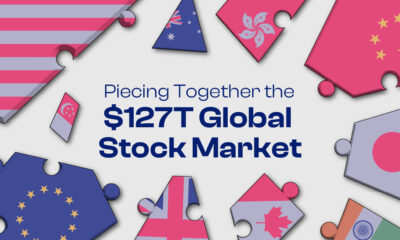
The $127 Trillion Global Stock Market in One Giant Chart
This graphic pieces together the $127T global stock market to reveal which countries and regions dominate—and how much equity they control.
-

Personal Finance2 months ago
Late to the Ladder: The Rise in First-Time Home Buyers’ Age
The median age of first-time home buyers has reached a historic high. See just how long it’s taking people to get on the property ladder.
-

Markets3 months ago
Unpacking Real Estate Ownership by Generation (1991 vs. 2025)
The Silent Generation’s share of real estate has dropped dramatically as people age, but how have Baby Boomers, Gen X, and Millennials fared?
-

Business3 months ago
America’s Economic Engines: The Biggest Industry in Every State
Real estate is the biggest industry by GDP in 26 states. Find out why it dominates—and what fuels the rest of the country.
-
Maps3 months ago
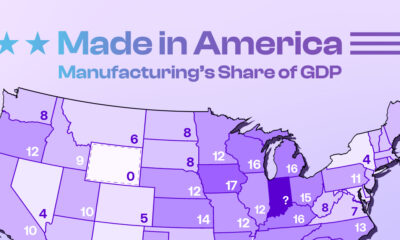
Mapped: Manufacturing as a Share of GDP, by U.S. State
Tariffs are rising to boost American-made goods. Which states gain the most—and least—from manufacturing today?
-

Technology4 months ago
Profit Powerhouses: Ranking The Top 10 U.S. Companies by Net Income
Collectively, the ten most profitable U.S. companies have a net income of $684 billion—more than the entire GDP of Belgium.
-

Money4 months ago
Millionaire Hubs: Mapping the World’s Wealthiest Cities
New York City has the highest millionaire population globally. Which other cities attract the world’s wealthiest?
-
Economy4 months ago
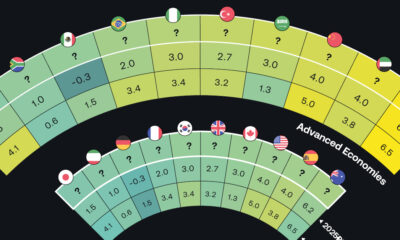
Tomorrow’s Growth: GDP Projections in Key Economies
The global economy is expected to have slighter slower growth going forward. Which countries are on track to have the biggest GDP increases?
-
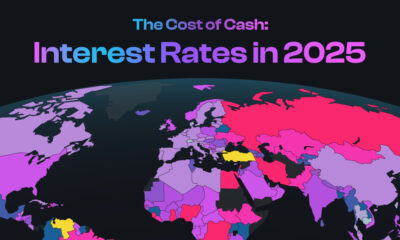
Money6 months ago
Mapped: Interest Rates by Country in 2025
The U.S. has kept their target rate the same at 4.25-4.50%. What do interest rates look like in other countries amid economic uncertainty?
-
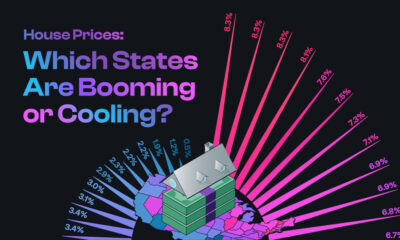
Markets7 months ago
U.S. Housing Prices: Which States Are Booming or Cooling?
The national housing market saw a 4.5% rise in house prices. This graphic reveals which states had high price growth, and which didn’t.
-
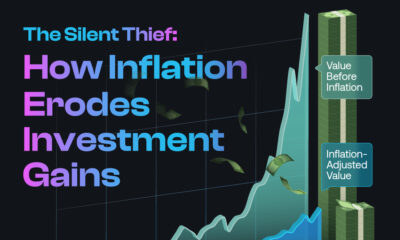
Investor Education7 months ago
The Silent Thief: How Inflation Erodes Investment Gains
If you held a $1,000 investment from 1975-2024, this chart shows how the inflation rate can drastically reduce the value of your money.
-
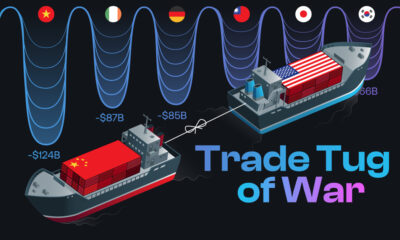
Politics8 months ago
Trade Tug of War: America’s Largest Trade Deficits
Trump cites trade deficits—the U.S. importing more than it exports—as one reason for tariffs. Which countries represent the largest deficits?
Subscribe
Please enable JavaScript in your browser to complete this form.Join 375,000+ email subscribers: *Sign Up