Published
25 minutes ago
on
November 3, 2025
| 381 views
-->
By
Julia Wendling
Graphics & Design
- Lebon Siu
The following content is sponsored by Terzo
The United States of Unemployment
Key Takeaways
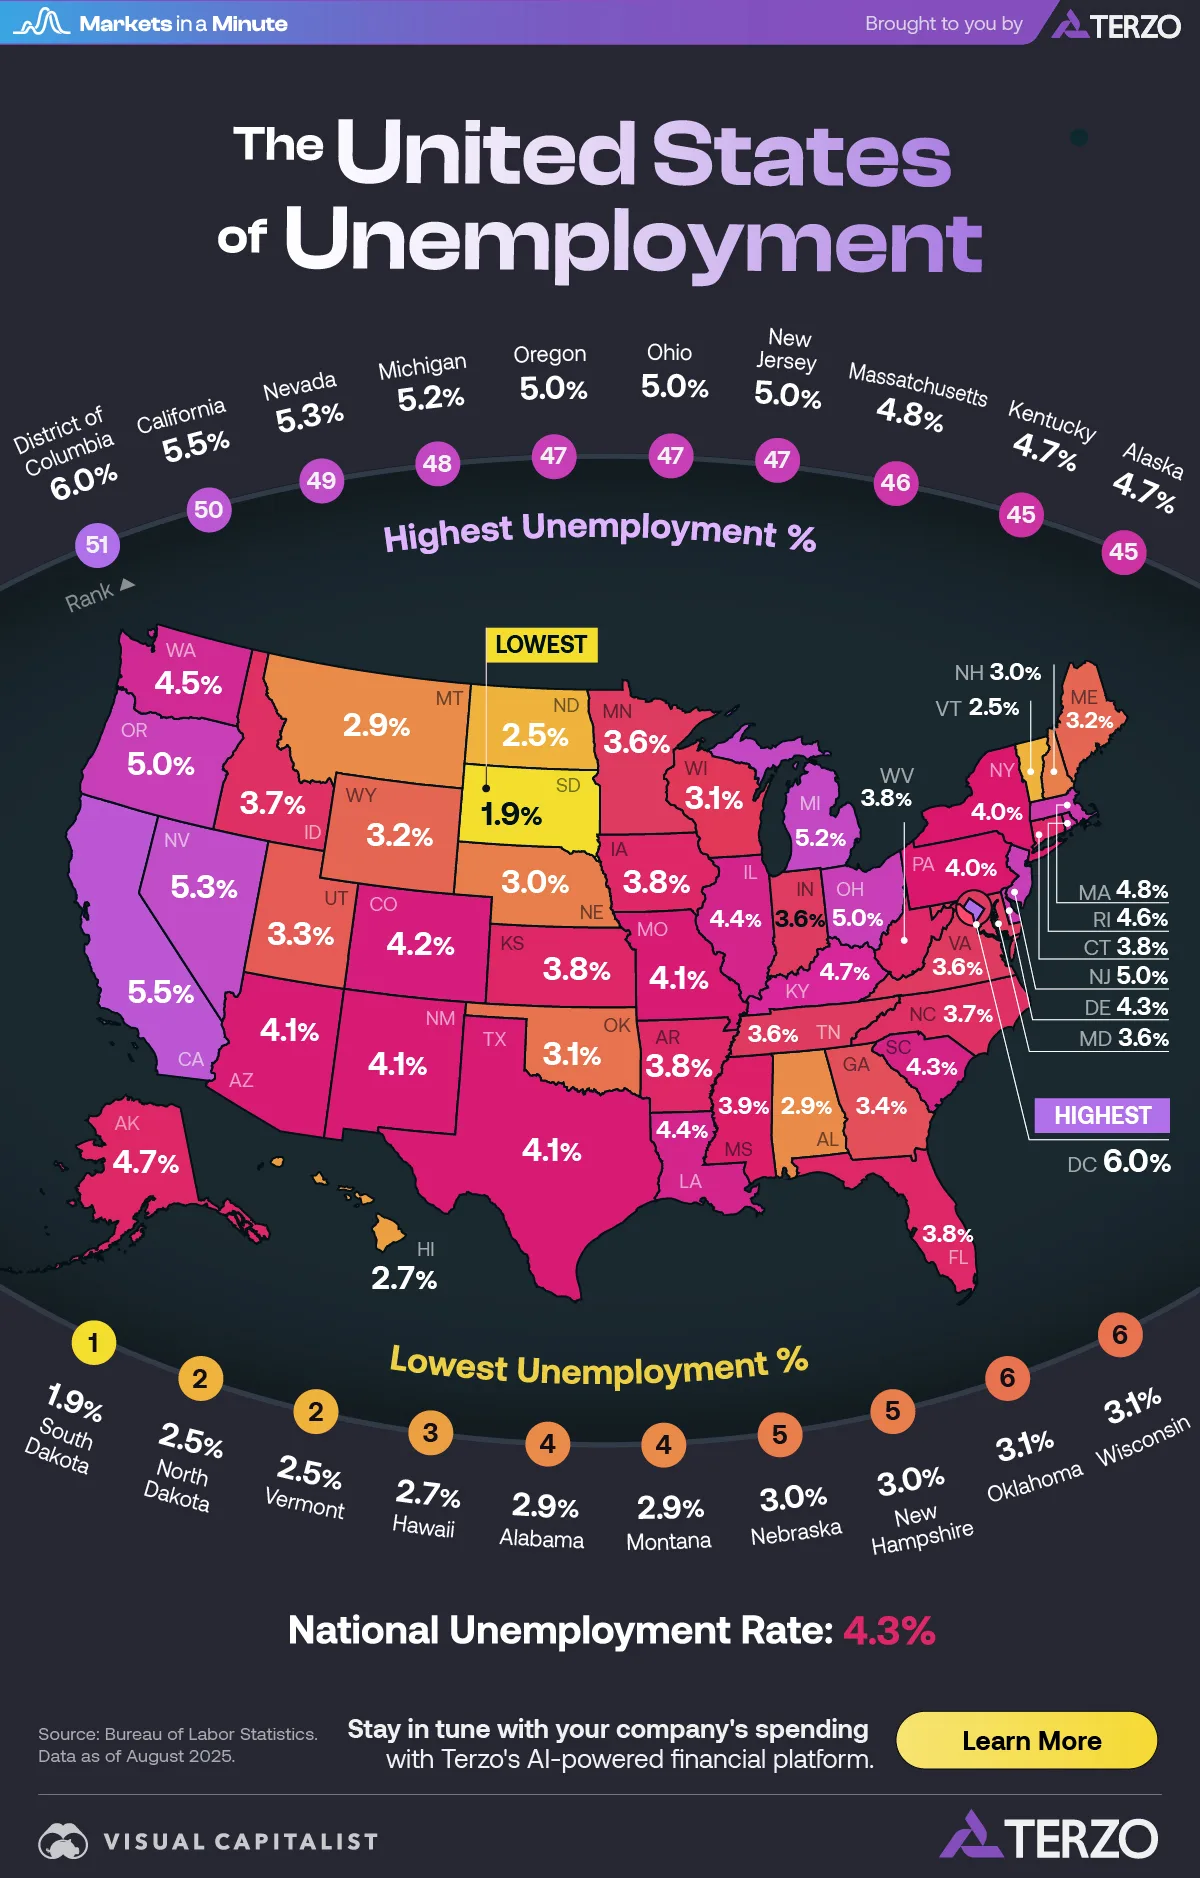
- As of August 2025, unemployment rates vary widely across the United States.
- The District of Columbia now has the highest unemployment rate at 6.0%, up from 5.3% in January.
The national unemployment rate for the U.S. rose to 4.3% in August 2025. But that figure masks vast differences in local labor market health across states.
In this Markets in a Minute graphic, created in partnership with Terzo, we map all 50 states and the District of Columbia by their August 2025 unemployment rates. Data is from the Bureau of Labor Statistics.
The National Picture
The U.S. unemployment rate rose to 4.3% in August, up slightly from 4.2% in July.
This was the second consecutive monthly increase and the highest level since October 2021. Long-term unemployment, which tracks the share of those unemployed for 27 weeks or more, rose for the third month in a row in August.
According to Reuters, the uptick reflects a softening economy, as higher tariffs and widespread public-sector layoffs strain the labor market amid ongoing geopolitical uncertainty.
Unemployment Rates by State
At the top of the list with the lowest unemployment rates are South Dakota (1.9%), North Dakota (2.5%), and Vermont (2.5%).
| State | Unemployment Rate (%) | Rank |
|---|---|---|
| South Dakota | 1.9 | 1 |
| North Dakota | 2.5 | 2 |
| Vermont | 2.5 | 2 |
| Hawaii | 2.7 | 4 |
| Alabama | 2.9 | 5 |
| Montana | 2.9 | 5 |
| Nebraska | 3.0 | 7 |
| New Hampshire | 3.0 | 7 |
| Oklahoma | 3.1 | 9 |
| Wisconsin | 3.1 | 9 |
| Maine | 3.2 | 11 |
| Wyoming | 3.2 | 11 |
| Utah | 3.3 | 13 |
| Georgia | 3.4 | 14 |
| Indiana | 3.6 | 15 |
| Maryland | 3.6 | 15 |
| Minnesota | 3.6 | 15 |
| Tennessee | 3.6 | 15 |
| Virginia | 3.6 | 15 |
| Idaho | 3.7 | 20 |
| North Carolina | 3.7 | 20 |
| Arkansas | 3.8 | 22 |
| Connecticut | 3.8 | 22 |
| Florida | 3.8 | 22 |
| Iowa | 3.8 | 22 |
| Kansas | 3.8 | 22 |
| West Virginia | 3.8 | 22 |
| Mississippi | 3.9 | 28 |
| New York | 4.0 | 29 |
| Pennsylvania | 4.0 | 29 |
| Arizona | 4.1 | 31 |
| Missouri | 4.1 | 31 |
| New Mexico | 4.1 | 31 |
| Texas | 4.1 | 31 |
| Colorado | 4.2 | 35 |
| Delaware | 4.3 | 36 |
| South Carolina | 4.3 | 36 |
| Illinois | 4.4 | 38 |
| Louisiana | 4.4 | 38 |
| Washington | 4.5 | 40 |
| Rhode Island | 4.6 | 41 |
| Alaska | 4.7 | 42 |
| Kentucky | 4.7 | 42 |
| Massachusetts | 4.8 | 44 |
| New Jersey | 5.0 | 45 |
| Ohio | 5.0 | 45 |
| Oregon | 5.0 | 45 |
| Michigan | 5.2 | 48 |
| Nevada | 5.3 | 49 |
| California | 5.5 | 50 |
| District of Columbia | 6.0 | 51 |
| National | 4.3 |
Conversely, California (5.5%), Nevada (5.3%), and Michigan (5.2%) are facing slower job growth. Tech layoffs and a weakening consumer spending profile are weighing on employment.
What’s Ahead
Economists and policymakers are closely watching for the delayed September employment report, postponed by the ongoing government shutdown. The report is a key indicator for investors, offering a clear read on the nation’s economic pulse and signaling areas of strength or weakness.
![]()
Stay in tune with your company’s spending, revenue, and risk with Terzo’s AI-powered financial platform.
More from Terzo
-

Markets1 week ago
Ranked: The Economies Most Dependent on International Trade
A trade war has threatened economic ties in 2025. Which economies are most exposed to these shifts in international trade?
-

Economy2 weeks ago
Top Countries Behind U.S. Tariff Revenue
Tariff rates vary by country, as does the value of goods each nation exports to the U.S. Which countries contribute the most?
-

Business3 weeks ago
Industries Hiring and Firing the Most Employees
As the U.S. labor market cools, which industries are still hiring—and which are cutting back their workforces?
-

Markets1 month ago
The $150T Global Debt Market
Global debt continues to climb, reaching $150T in Q1 2025. Which countries carry the heaviest burdens?
-
Money2 months ago
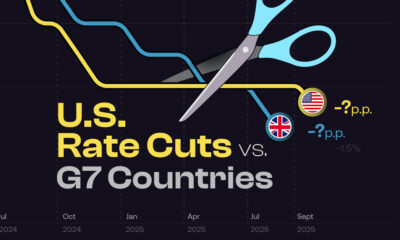
NEW: Fed Rate Cuts vs. Other G7 Countries
How do Fed rate cuts in the U.S. compare with the interest rate changes in other G7 countries, and what does it mean for business?
-
Jobs2 months ago
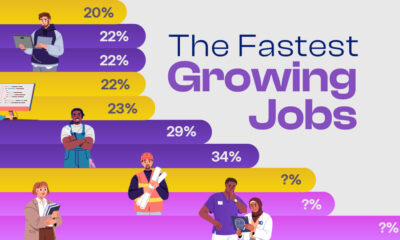
Ranked: The Fastest Growing Jobs (2024-2034)
Explore the fastest growing jobs by projected growth rate, plus salary insights, in a rapidly changing job market.
-

Investor Education2 months ago
The $127 Trillion Global Stock Market in One Giant Chart
This graphic pieces together the $127T global stock market to reveal which countries and regions dominate—and how much equity they control.
-

Personal Finance3 months ago
Late to the Ladder: The Rise in First-Time Home Buyers’ Age
The median age of first-time home buyers has reached a historic high. See just how long it’s taking people to get on the property ladder.
-

Markets3 months ago
Unpacking Real Estate Ownership by Generation (1991 vs. 2025)
The Silent Generation’s share of real estate has dropped dramatically as people age, but how have Baby Boomers, Gen X, and Millennials fared?
-
Business3 months ago
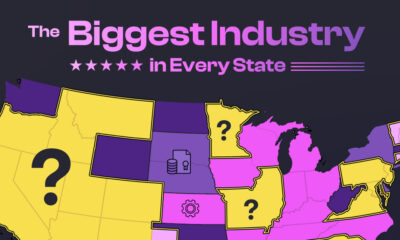
America’s Economic Engines: The Biggest Industry in Every State
Real estate is the biggest industry by GDP in 26 states. Find out why it dominates—and what fuels the rest of the country.
-
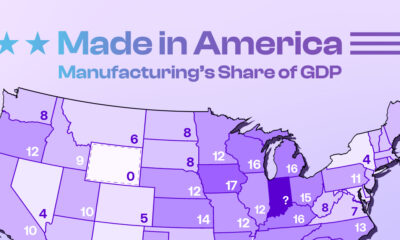
Maps4 months ago
Mapped: Manufacturing as a Share of GDP, by U.S. State
Tariffs are rising to boost American-made goods. Which states gain the most—and least—from manufacturing today?
-

Technology4 months ago
Profit Powerhouses: Ranking The Top 10 U.S. Companies by Net Income
Collectively, the ten most profitable U.S. companies have a net income of $684 billion—more than the entire GDP of Belgium.
-

Money4 months ago
Millionaire Hubs: Mapping the World’s Wealthiest Cities
New York City has the highest millionaire population globally. Which other cities attract the world’s wealthiest?
-
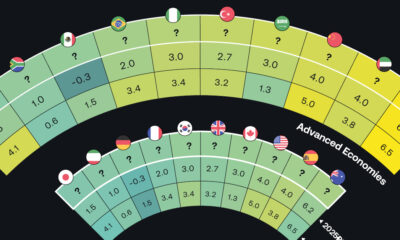
Economy5 months ago
Tomorrow’s Growth: GDP Projections in Key Economies
The global economy is expected to have slighter slower growth going forward. Which countries are on track to have the biggest GDP increases?
-
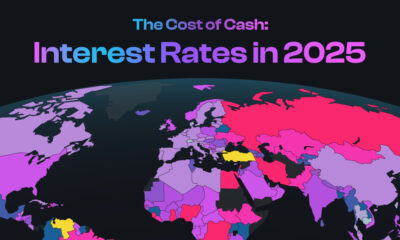
Money6 months ago
Mapped: Interest Rates by Country in 2025
The U.S. has kept their target rate the same at 4.25-4.50%. What do interest rates look like in other countries amid economic uncertainty?
-
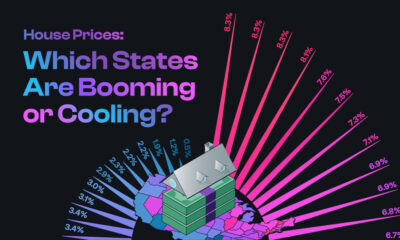
Markets7 months ago
U.S. Housing Prices: Which States Are Booming or Cooling?
The national housing market saw a 4.5% rise in house prices. This graphic reveals which states had high price growth, and which didn’t.
-

Investor Education7 months ago
The Silent Thief: How Inflation Erodes Investment Gains
If you held a $1,000 investment from 1975-2024, this chart shows how the inflation rate can drastically reduce the value of your money.
-

Politics8 months ago
Trade Tug of War: America’s Largest Trade Deficits
Trump cites trade deficits—the U.S. importing more than it exports—as one reason for tariffs. Which countries represent the largest deficits?
Subscribe
Please enable JavaScript in your browser to complete this form.Join 375,000+ email subscribers: *Sign Up