![]()
See more visuals like this on the Voronoi app.
Use This Visualization
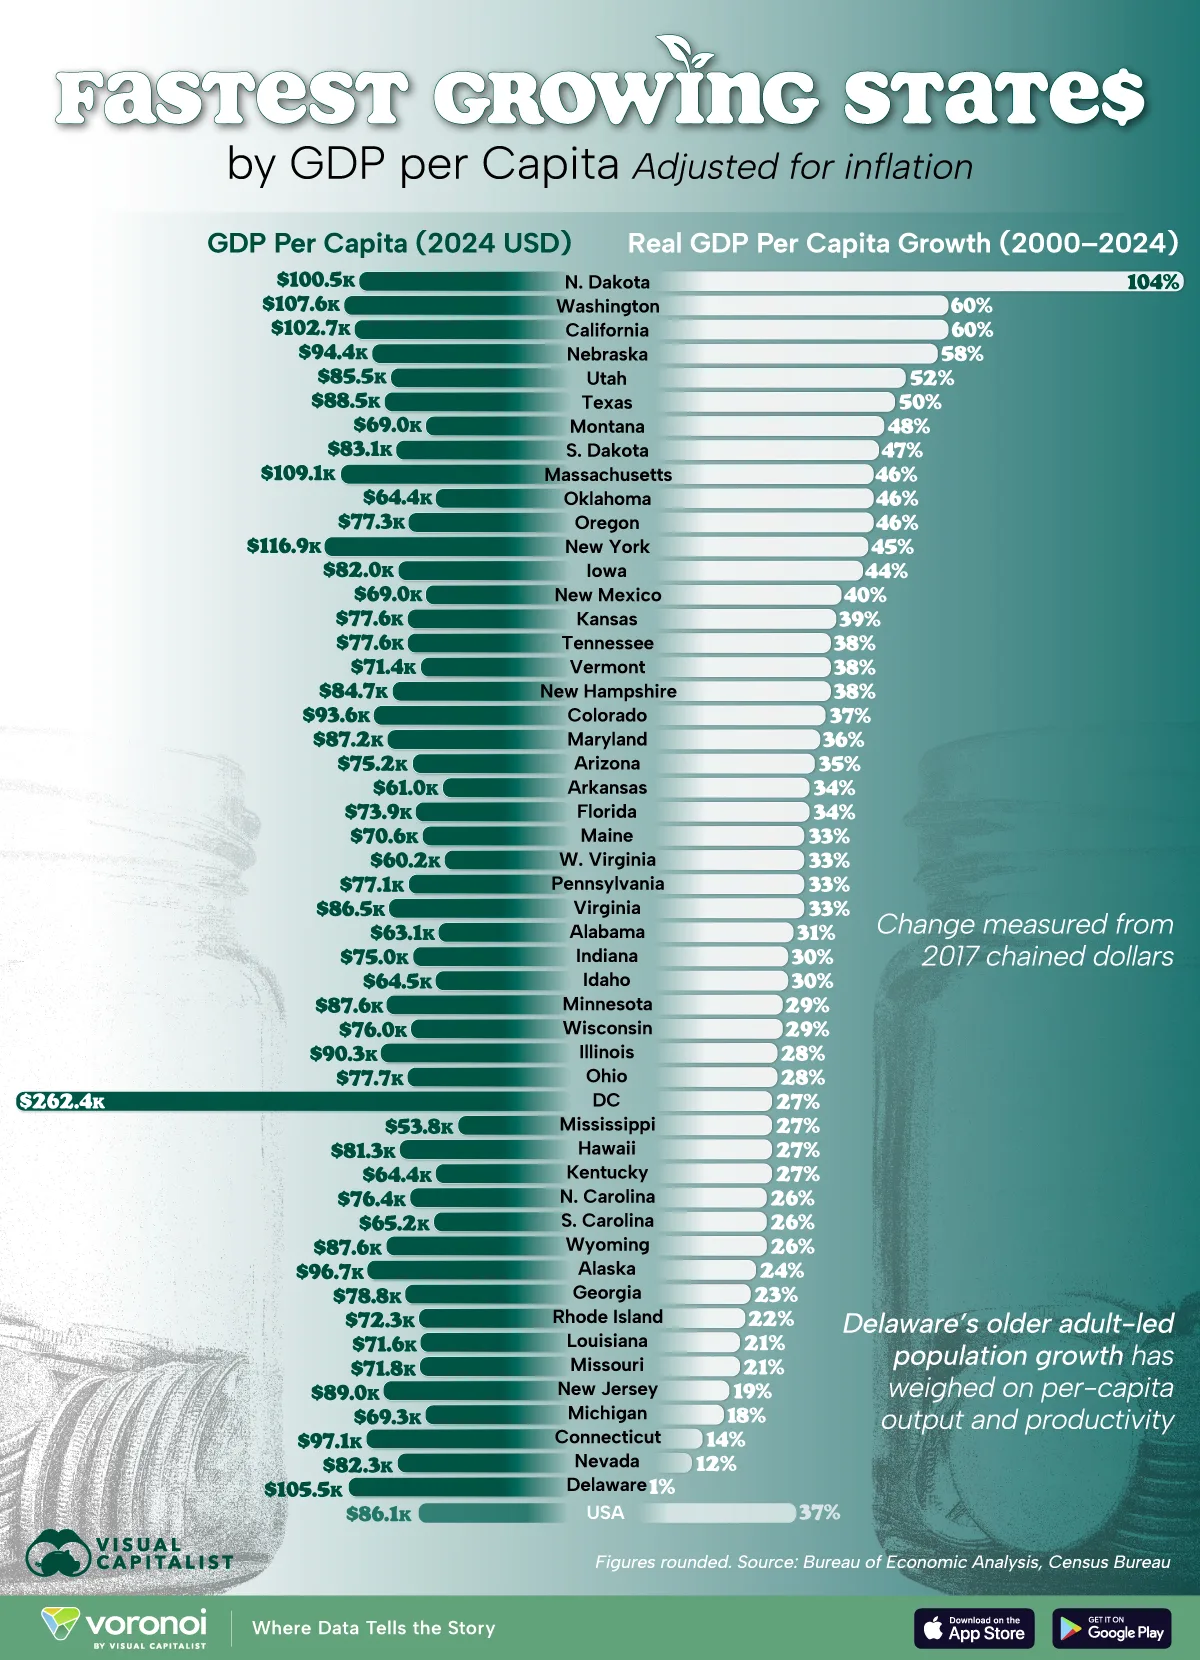
Ranked: U.S. States by GDP Per Capita Growth (2000-2024)
See visuals like this from many other data creators on our Voronoi app. Download it for free on iOS or Android and discover incredible data-driven charts from a variety of trusted sources.
Key Takeaways
- States like North Dakota and Texas have benefited from their surging energy sectors.
- Tech hubs like Washington (home to Microsoft) and California have also grown well above the average rate.
The U.S. economy has grown significantly over the past two decades, but the pace of growth has not been even from state to state.
In this graphic, we ranked each state by its real GDP per capita growth from 2000 to 2024, adjusted for inflation. Current GDP per capita figures (2024) were included for a second layer of context.
Data & Discussion
The data for this visualization was sourced from the U.S. Bureau of Economic Analysis and the Census Bureau.
| Region | Real GDP Per Capita Change (2000–2024) |
GDP Per Capita (2024 USD) |
|---|---|---|
| North Dakota | 104% | $100,504 |
| Washington | 60% | $107,564 |
| California | 60% | $102,662 |
| Nebraska | 58% | $94,364 |
| Utah | 52% | $85,475 |
| Texas | 50% | $88,517 |
| Montana | 48% | $68,975 |
| South Dakota | 47% | $83,052 |
| Massachusetts | 46% | $109,095 |
| Oklahoma | 46% | $64,388 |
| Oregon | 46% | $77,299 |
| New York | 45% | $116,883 |
| Iowa | 44% | $81,998 |
| New Mexico | 40% | $69,046 |
| Kansas | 39% | $77,601 |
| Tennessee | 38% | $77,645 |
| Vermont | 38% | $71,359 |
| New Hampshire | 38% | $84,694 |
| Colorado | 37% | $93,602 |
| Maryland | 36% | $87,180 |
| Arizona | 35% | $75,186 |
| Arkansas | 34% | $60,984 |
| Florida | 34% | $73,879 |
| Maine | 33% | $70,586 |
| West Virginia | 33% | $60,156 |
| Pennsylvania | 33% | $77,062 |
| Virginia | 33% | $86,451 |
| Alabama | 31% | $63,080 |
| Indiana | 30% | $75,028 |
| Idaho | 30% | $64,457 |
| Minnesota | 29% | $87,636 |
| Wisconsin | 29% | $76,044 |
| Illinois | 28% | $90,330 |
| Ohio | 28% | $77,684 |
| District of Columbia | 27% | $262,439 |
| Mississippi | 27% | $53,751 |
| Hawaii | 27% | $81,339 |
| Kentucky | 27% | $64,375 |
| North Carolina | 26% | $76,427 |
| South Carolina | 26% | $65,173 |
| Wyoming | 26% | $87,639 |
| Alaska | 24% | $96,695 |
| Georgia | 23% | $78,841 |
| Rhode Island | 22% | $72,265 |
| Louisiana | 21% | $71,594 |
| Missouri | 21% | $71,846 |
| New Jersey | 19% | $89,045 |
| Michigan | 18% | $69,274 |
| Connecticut | 14% | $97,096 |
| Nevada | 12% | $82,330 |
| Delaware | 1% | $105,495 |
| U.S. Average | 37% | $86,143 |
Energy States Post Strong Growth
North Dakota leads the nation with a remarkable 104% increase in real GDP per capita since 2000.
Its shale oil boom dramatically reshaped its economy, making it America’s third largest oil producer as of 2024.
Texas (+50%) also benefited from strong energy production and related investment flows.
Tech Hubs Continue to Outperform
Washington and California each posted 60% growth, outpacing the national average of 37%.
Washington now boasts one of the highest GDP-per-capita levels in the country at $107,564, supported by its deep technology ecosystem anchored by Microsoft, Amazon, and a broad base of high-productivity industries.
California similarly benefits from Silicon Valley’s innovation engine, which drives strong per-worker economic output even after accounting for the the state’s massive population.
Learn More on the Voronoi App ![]()
If you enjoyed today’s post, check out America’s Fastest Growing States by Population on Voronoi, the new app from Visual Capitalist.