![]()
See more visuals like this on the Voronoi app.
Use This Visualization
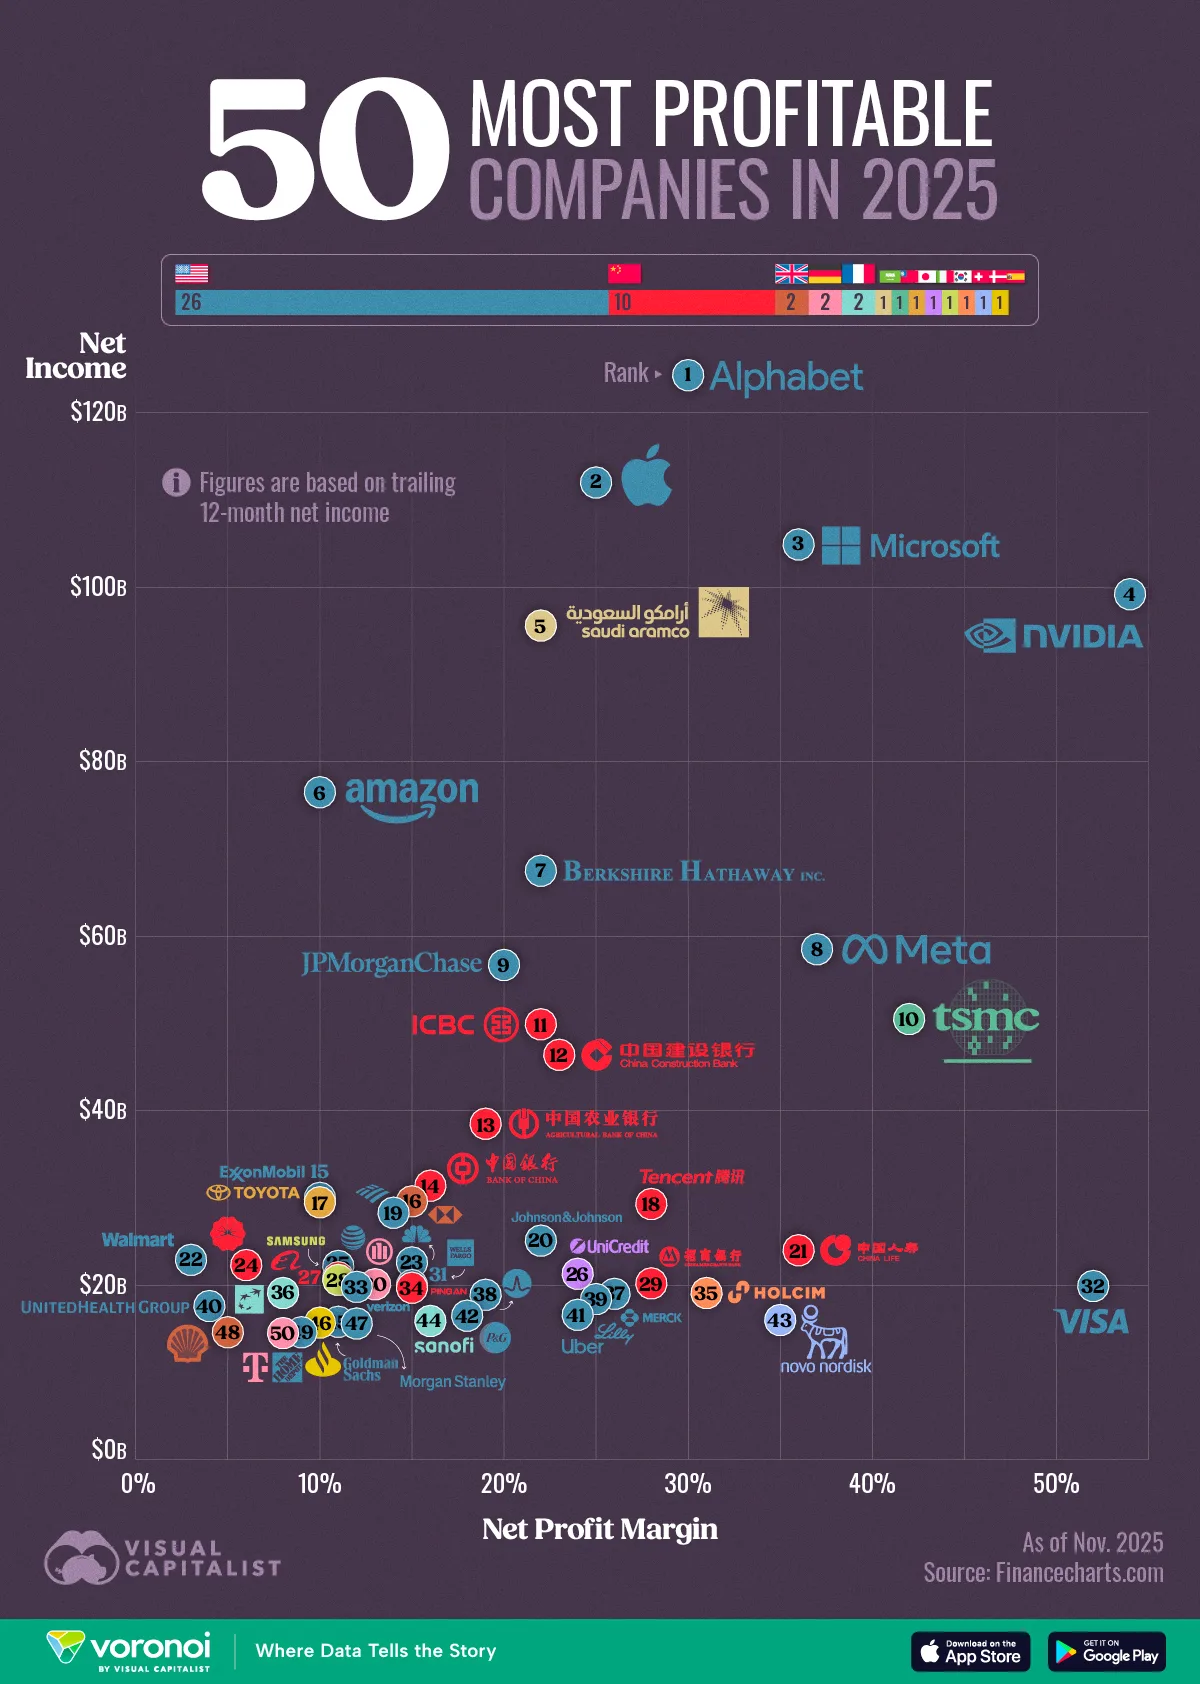
Ranked: The World’s Most Profitable Companies in 2025
See visuals like this from many other data creators on our Voronoi app. Download it for free on iOS or Android and discover incredible data-driven charts from a variety of trusted sources.
Key Takeaways
- Alphabet, Apple, and Microsoft lead global profitability, each earning over $100B in net income.
- U.S. companies dominate the list, but major Asian and European giants also rank among the top earners.
The ranking of the world’s most profitable companies in 2025 highlights a powerful concentration of earnings across technology, finance, and energy.
The data for this visualization comes from FinanceCharts.com. It ranks companies by trailing 12-month net income as of November 2025 and shows the profit margins behind those earnings.
Tech Giants Lead by a Wide Margin
As in previous years, technology firms dominate the top of the ranking, with Alphabet earning $124.3 billion and Apple and Microsoft close behind. These companies benefit from high-margin digital services, advertising platforms, and enterprise software, all of which scale efficiently.
| Rank | Name | TTM Net Income | TTM Net Profit Margin |
|---|---|---|---|
| 1 | Alphabet | $124.3B | 30.1% |
| 2 | Apple | $112.0B | 24.8% |
| 3 | Microsoft | $104.9B | 35.7% |
| 4 | NVIDIA | $99.2B | 53.7% |
| 5 | Saudi Aramco | $95.6B | 21.7% |
| 6 | Amazon.com | $76.5B | 9.8% |
| 7 | Berkshire Hathaway | $67.5B | 22.0% |
| 8 | Meta Platforms | $58.5B | 36.7% |
| 9 | JPMorgan Chase & Co | $56.7B | 20.1% |
| 10 | Taiwan Semiconductor | $50.5B | 41.6% |
| 11 | Industrial and Commerci.. | $49.9B | 21.7% |
| 12 | China Construction Bank | $46.4B | 23.4% |
| 13 | Agricultural Bank of Ch.. | $38.5B | 18.8% |
| 14 | Bank of China | $31.4B | 16.3% |
| 15 | Exxon Mobil | $30.0B | 9.7% |
| 16 | HSBC Holdings | $29.6B | 14.7% |
| 17 | Toyota Motor | $29.5B | 9.6% |
| 18 | Tencent Holdings | $29.3B | 27.8% |
| 19 | Bank of America | $28.3B | 13.5% |
| 20 | Johnson & Johnson | $25.1B | 21.9% |
| 21 | China Life Insurance | $24.0B | 35.6% |
| 22 | Walmart | $22.9B | 3.0% |
| 23 | Comcast | $22.6B | 14.9% |
| 24 | PetroChina | $22.3B | 5.6% |
| 25 | AT&T | $22.2B | 10.7% |
| 26 | UniCredit SpA | $21.3B | 23.8% |
| 27 | Alibaba Group Holding | $20.9B | 11.3% |
| 28 | Samsung Electronics | $20.6B | 10.6% |
| 29 | China Merchants Bank | $20.2B | 28.3% |
| 30 | Allianz | $20.1B | 13.2% |
| 31 | Wells Fargo & Co | $20.0B | 15.2% |
| 32 | Visa | $19.9B | 52.2% |
| 33 | Verizon Communications | $19.8B | 12.2% |
| 34 | Ping An Insurance (Grou.. | $19.7B | 14.6% |
| 35 | Holcim | $19.1B | 31.4% |
| 36 | BNP Paribas | $19.1B | 8.5% |
| 37 | Merck & Co | $19.0B | 25.7% |
| 38 | Broadcom | $18.9B | 19.0% |
| 39 | Eli Lilly and Co | $18.4B | 24.7% |
| 40 | UnitedHealth Group | $17.6B | 4.3% |
| 41 | Uber Technologies | $16.6B | 24.0% |
| 42 | Procter & Gamble | $16.5B | 18.2% |
| 43 | Novo Nordisk | $16.0B | 34.6% |
| 44 | Sanofi | $15.9B | 16.2% |
| 45 | Goldman Sachs Group | $15.8B | 11.1% |
| 46 | Banco Santander | $15.7B | 9.8% |
| 47 | Morgan Stanley | $15.6B | 12.1% |
| 48 | Shell | $14.6B | 5.2% |
| 49 | Home Depot | $14.6B | 9.0% |
| 50 | Deutsche Telekom | $14.5B | 8.1% |
NVIDIA stands out with a remarkable 53.7% profit margin, underscoring how demand for AI chips continues to reshape the semiconductor industry. Together, the top U.S. tech firms account for several hundred billion dollars in annual profit, more than entire sectors in some countries.
Financial Institutions Are Global Profit Engines
JPMorgan Chase, Bank of America, and Wells Fargo all appear in the top 50, contributing tens of billions in profit.
China’s “Big Four” banks—ICBC, China Construction Bank, Agricultural Bank of China, and Bank of China—also rank highly thanks to scale and extensive domestic networks.
European firms such as HSBC, BNP Paribas, and Santander add further evidence that financial services remain one of the world’s most profitable industries.
Energy, Pharmaceuticals, and Retail Show Mixed Results
Saudi Aramco remains the world’s most profitable non-tech operator, generating $95.6 billion from energy production despite market volatility. Pharma companies like Merck, Eli Lilly, and Novo Nordisk show strong margins driven by high-value therapeutics and blockbuster drug pipelines.
In contrast, retail giants such as Walmart and Home Depot post lower margins due to their cost-intensive structures, though their absolute profits still place them among the world’s leaders.
Learn More on the Voronoi App ![]()
If you enjoyed today’s post, check out When Will the Next $5 Trillion Dollar Company Emerge? on Voronoi, the new app from Visual Capitalist.