![]()
See more visualizations like this on the Voronoi app.
Use This Visualization
Mapped: The U.S. Homeownership Rate by State
See visuals like this from many other data creators on our Voronoi app. Download it for free on iOS or Android and discover incredible data-driven charts from a variety of trusted sources.
Key Takeaways
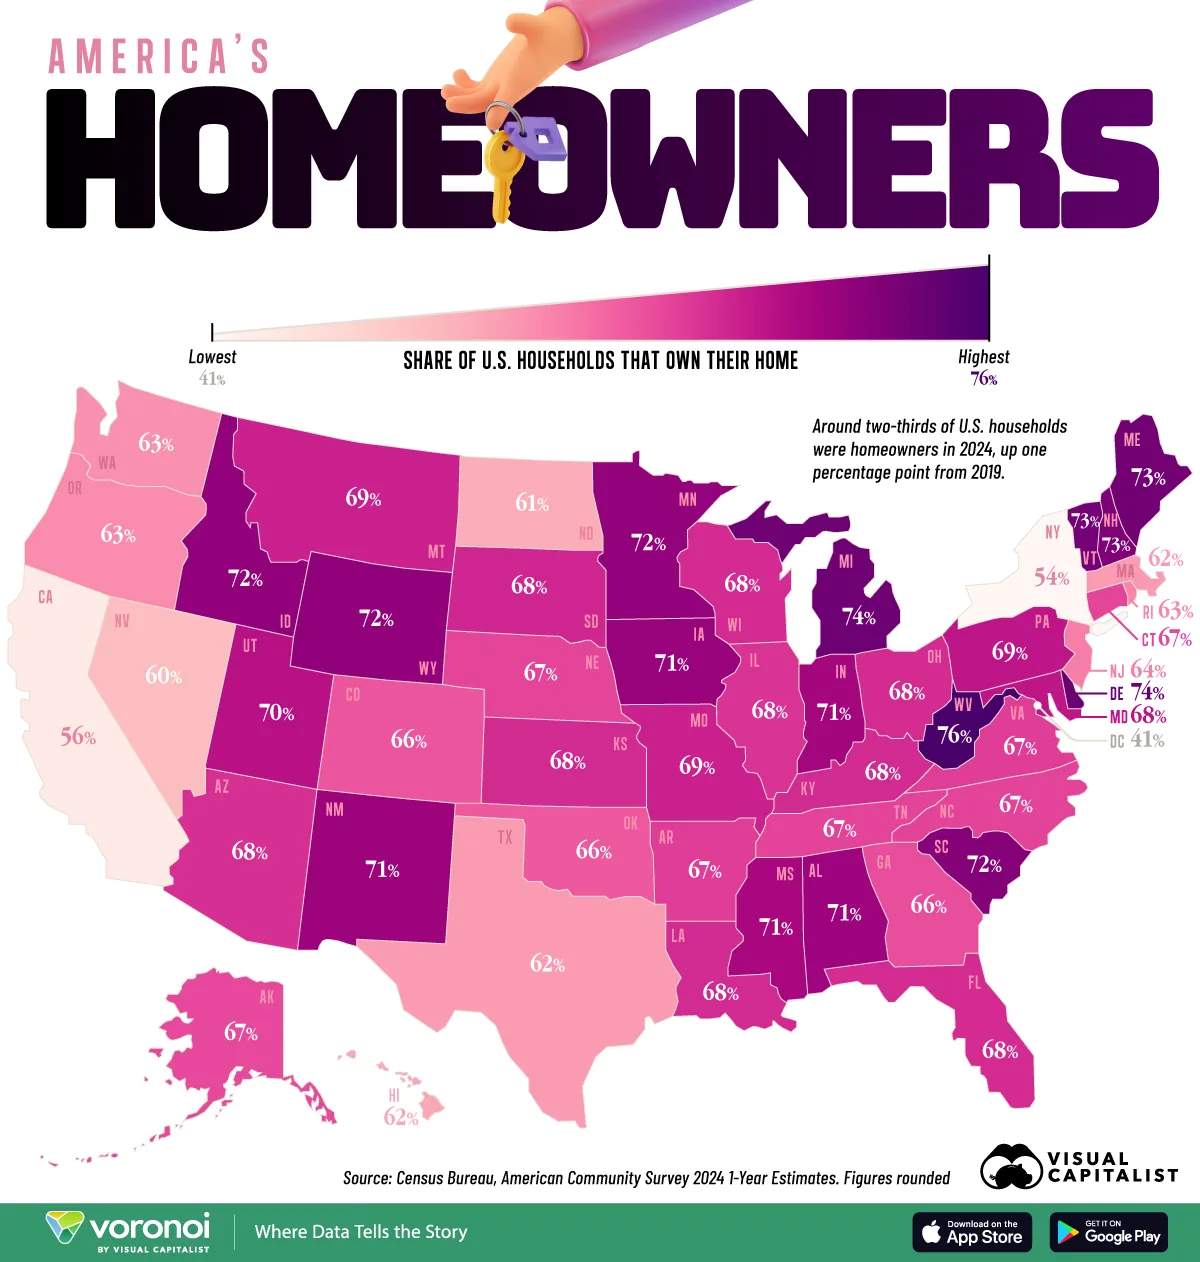
- West Virginia has the highest share of homeowners in the country, at 76% of households in 2024.
- Washington, D.C., New York, and California have the lowest homeownership rates, given limited housing stock and persistently elevated prices.
Homeownership is a traditional path for building wealth, with about two-thirds of U.S. households falling into this category.
While nearly 60% of baby boomers owned homes by the age of 33, this figure has shrunk to about 40% for millennials. Today, boomers continue to own the greatest share of real estate by generation, outpacing millennials by about twofold.
This graphic shows homeownership rates across America, based on data from the U.S. Census Bureau.
Which States Have the Highest Homeownership Rate?
Below, we show the share of homeowners in each state based on 2024 estimates:
| Rank | State | Homeownership Rate in 2024 (%) |
|---|---|---|
| 1 | West Virginia | 75.5 |
| 2 | Delaware | 73.8 |
| 3 | Michigan | 73.5 |
| 4 | Maine | 73.3 |
| 5 | Vermont | 73.2 |
| 6 | New Hampshire | 72.6 |
| 7 | South Carolina | 72.3 |
| 8 | Idaho | 71.7 |
| 9 | Wyoming | 71.7 |
| 10 | Minnesota | 71.6 |
| 11 | Iowa | 71.3 |
| 12 | New Mexico | 71.1 |
| 13 | Alabama | 71.0 |
| 14 | Indiana | 70.7 |
| 15 | Mississippi | 70.5 |
| 16 | Utah | 69.6 |
| 17 | Puerto Rico | 69.3 |
| 18 | Pennsylvania | 69.3 |
| 19 | Montana | 68.6 |
| 20 | Missouri | 68.6 |
| 21 | South Dakota | 68.3 |
| 22 | Kentucky | 68.1 |
| 23 | Kansas | 68.1 |
| 24 | Louisiana | 68.1 |
| 25 | Florida | 68.0 |
| 26 | Ohio | 68.0 |
| 27 | Wisconsin | 68.0 |
| 28 | Maryland | 67.8 |
| 29 | Arizona | 67.8 |
| 30 | Illinois | 67.6 |
| 31 | Virginia | 67.1 |
| 32 | Arkansas | 67.1 |
| 33 | North Carolina | 66.8 |
| 34 | Tennessee | 66.8 |
| 35 | Nebraska | 66.7 |
| 36 | Connecticut | 66.7 |
| 37 | Alaska | 66.5 |
| 38 | Georgia | 66.3 |
| 39 | Colorado | 65.9 |
| 40 | Oklahoma | 65.7 |
| 41 | New Jersey | 63.9 |
| 42 | Rhode Island | 63.5 |
| 43 | Oregon | 63.1 |
| 44 | Washington | 62.9 |
| 45 | Massachusetts | 62.4 |
| 46 | Texas | 62.3 |
| 47 | Hawaii | 61.7 |
| 48 | North Dakota | 61.2 |
| 49 | Nevada | 60.1 |
| 50 | California | 55.8 |
| 51 | New York | 54.3 |
| 52 | District of Columbia | 40.9 |
West Virginia leads nationally, with over three-quarters of residents owning homes.
The Mountain State is known for its affordability, requiring a household salary of just $71,000 to buy a home in 2025. What’s more, this is for a typical three-bedroom home, with a 10% down payment and a 6.67% mortgage rate.
Delaware ranks in second, at 73.8%, while several other small, coastal states rank among the top 10.
On the other end of the spectrum, 40.9% of residents in Washington, D.C. own real estate, lower than both New York (54.3%) and California (55.8%). High land values, restrictive zoning, and out-of-state migration are key factors that have reduced affordability in the nation’s capital.
Learn More on the Voronoi App ![]()
To learn more about this topic, check out this graphic on rent and home price changes across major global cities since 2015.