Published
38 minutes ago
on
December 8, 2025
| 4 views
-->
By
Jenna Ross
Graphics & Design
- Jennifer West
- Zack Aboulazm
The following content is sponsored by Terzo
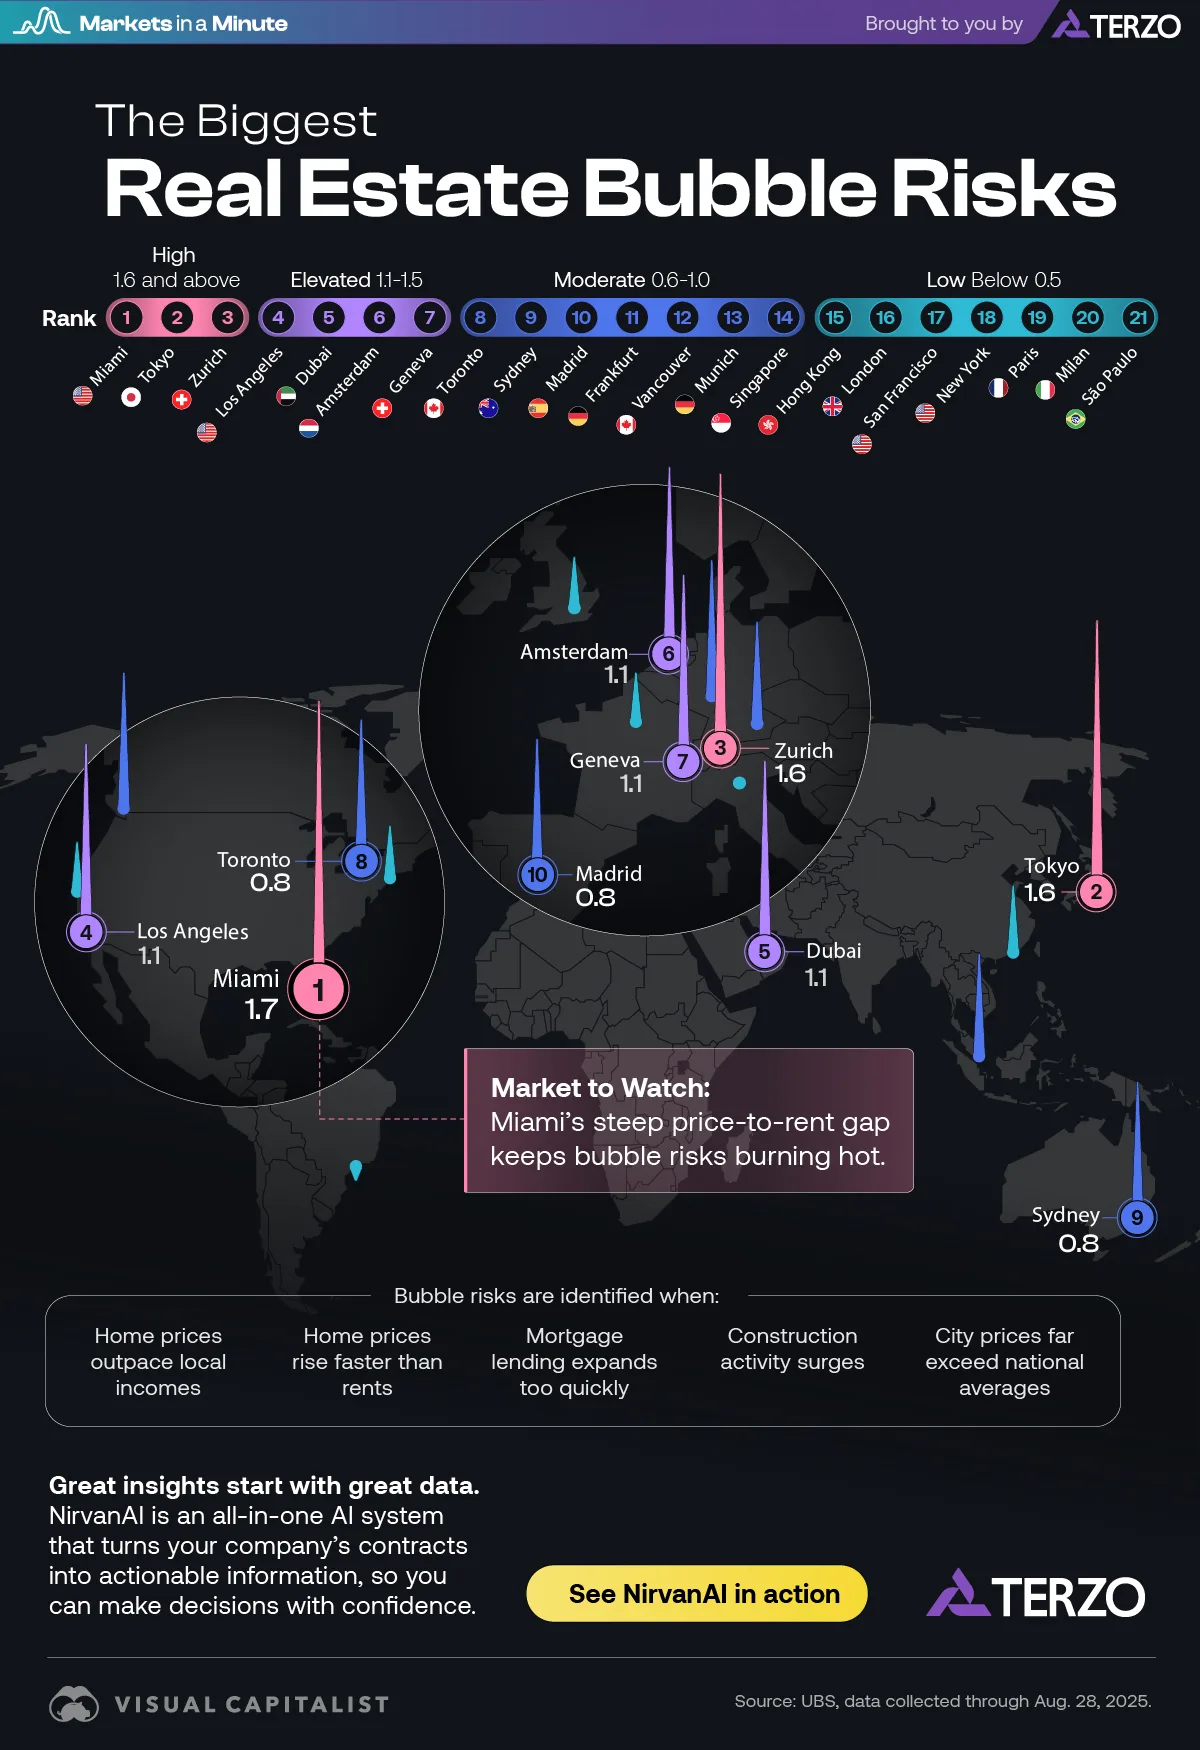
Mapped: The Biggest Housing Bubble Risks Globally
Key Takeaways
- Miami has the highest housing bubble risk in 2025, driven by an extreme price-to-rent gap.
- Tokyo and Zurich also show high risk due to investor demand and low financing costs.
Which housing markets could be headed for a correction? In cities like Miami, Zurich, and Tokyo, real estate prices are pushing past what local incomes and rents can justify. Amid these high prices, investors are watching closely for signs of instability.
This graphic, created in partnership with Terzo, shows the level of housing bubble risk for major cities globally. It’s part of our Markets in a Minute series, which features quick economic insights for executives.
What is a Real Estate Bubble?
A “bubble” is a large and long-term mispricing of an asset, which can only be identified in hindsight when the bubble bursts and prices plummet.
UBS examined five factors to gauge bubble risks:
- Home prices outpace local incomes
- Home prices rise faster than rents
- Mortgage lending expands too quickly
- Construction activity surges
- City prices far exceed national averages
These factors are correlated with previous housing bubbles and help determine risk levels, but they cannot predict if or when a correction will happen.
The Top Bubble Risks, Ranked
UBS analyzed 21 select cities globally. Miami has the highest bubble risk score. Although price growth has slowed, its price-to-rent ratio is now above 2006 bubble–era levels.
| Rank | City | Bubble Risk Category | Bubble Risk Score |
|---|---|---|---|
| 1 | Miami | High | 1.7 |
| 2 | Tokyo | High | 1.6 |
| 3 | Zurich | High | 1.6 |
| 4 | Los Angeles | Elevated | 1.1 |
| 5 | Dubai | Elevated | 1.1 |
| 6 | Amsterdam | Elevated | 1.1 |
| 7 | Geneva | Elevated | 1.1 |
| 8 | Toronto | Moderate | 0.8 |
| 9 | Sydney | Moderate | 0.8 |
| 10 | Madrid | Moderate | 0.8 |
| 11 | Frankfurt | Moderate | 0.8 |
| 12 | Vancouver | Moderate | 0.8 |
| 13 | Munich | Moderate | 0.6 |
| 14 | Singapore | Moderate | 0.6 |
| 15 | Hong Kong | Low | 0.4 |
| 16 | London | Low | 0.3 |
| 17 | San Francisco | Low | 0.3 |
| 18 | New York | Low | 0.3 |
| 19 | Paris | Low | 0.3 |
| 20 | Milan | Low | 0.0 |
| 21 | São Paulo | Low | -0.1 |
Source: UBS, data collected through Aug. 28, 2025.
Tokyo follows closely, driven by persistent price increases despite only modest rent and income gains.
Zurich rounds out the top three, with property values rising five times faster than incomes over the past decade. The city now has the world’s highest price-to-rent multiple—it would take 43 years of rent to buy an apartment of the same size.
While these cities remain magnets for investment and migration, affordability is stretched thin. In Tokyo and Zurich, sustained investor demand and low financing costs have fueled further appreciation.
Year-Over-Year Shifts
Some cities have seen notable shifts in risk. Toronto and Hong Kong had the biggest declines in their risk scores, thanks to declining real prices and tighter regulations.
On the other hand, Dubai and Madrid climbed the ranks. Dubai, in particular, has experienced a sharp price rebound alongside robust rent growth. Because prices are still affordable relative to other major global cities, optimistic investors are hoping for strong future returns.
Why Housing Bubble Risks Matter
For executives and asset managers, these rankings serve as a warning. In cities with high bubble risk, a price correction could sharply reduce the value of real estate holdings. Investors with concentrated exposure to markets like Miami or Zurich may want to reassess their risk profile.
Likewise, corporate location planning and real estate strategy may need to adapt. As affordability erodes, workforce retention could suffer as employees move to less pricey areas.
Great insights, like these housing bubble risks, start with great data. NirvanAI is an all-in-one AI system that turns your company’s contract data into actionable information.
![]()
See NirvanAI in action and learn how it helps you make decisions with confidence.
More from Terzo
-

Technology6 days ago
Ranked: The Top Factors That Build AI Trust
Want AI your team will trust? Pull back the curtain on the top factors that make people believe in artificial intelligence.
-

Technology2 weeks ago
Ranked: AI Hallucination Rates by Model
Find out how common AI hallucination is for leading models, and what that means for the businesses that rely on them.
-

Technology2 weeks ago
The Dangers of AI: Visualizing the Top Risks Companies Face
Among the dangers of AI, one stands apart as causing trouble for almost a third of companies. What do leaders need to know?
-

Business3 weeks ago
Ranked: Which Universities Build the Most Entrepreneurs?
Which university has had the most alumni become entrepreneurs in the last decade? Hint: its not Stanford or Harvard.
-

Economy4 weeks ago
Mapped: Where Workers Are Supporting the Most Seniors
In many advanced economies, the number of retirees is climbing while the working-age population shrinks. What are the countries where workers are supporting the most seniors?
-
Economy1 month ago
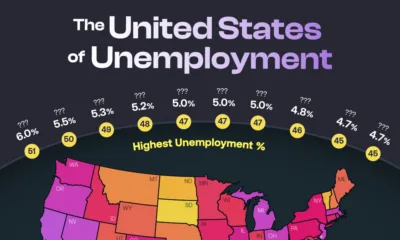
The United States of Unemployment
The national unemployment rate for the U.S. rose to 4.3% in August 2025. But that figure masks vast differences in local labor market health across states.
-
Markets1 month ago
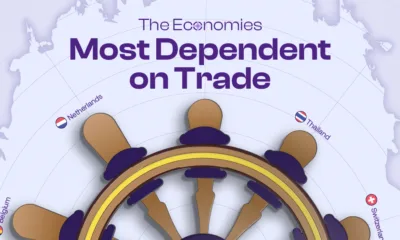
Ranked: The Economies Most Dependent on International Trade
A trade war has threatened economic ties in 2025. Which economies are most exposed to these shifts in international trade?
-

Economy2 months ago
Top Countries Behind U.S. Tariff Revenue
Tariff rates vary by country, as does the value of goods each nation exports to the U.S. Which countries contribute the most?
-

Business2 months ago
Industries Hiring and Firing the Most Employees
As the U.S. labor market cools, which industries are still hiring—and which are cutting back their workforces?
-

Markets2 months ago
The $150T Global Debt Market
Global debt continues to climb, reaching $150T in Q1 2025. Which countries carry the heaviest burdens?
-
Money3 months ago
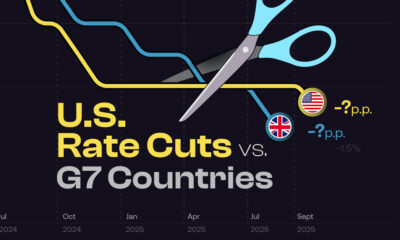
NEW: Fed Rate Cuts vs. Other G7 Countries
How do Fed rate cuts in the U.S. compare with the interest rate changes in other G7 countries, and what does it mean for business?
-
Jobs3 months ago
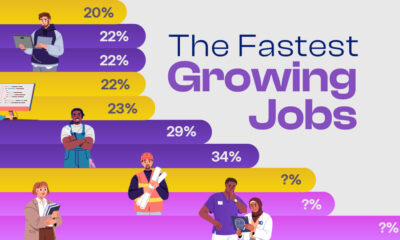
Ranked: The Fastest Growing Jobs (2024-2034)
Explore the fastest growing jobs by projected growth rate, plus salary insights, in a rapidly changing job market.
-

Investor Education4 months ago
The $127 Trillion Global Stock Market in One Giant Chart
This graphic pieces together the $127T global stock market to reveal which countries and regions dominate—and how much equity they control.
-
Personal Finance4 months ago
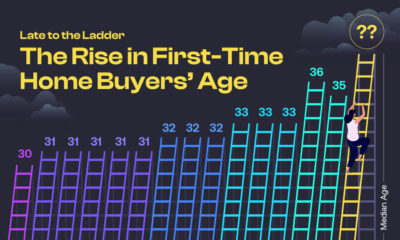
Late to the Ladder: The Rise in First-Time Home Buyers’ Age
The median age of first-time home buyers has reached a historic high. See just how long it’s taking people to get on the property ladder.
-
Markets4 months ago
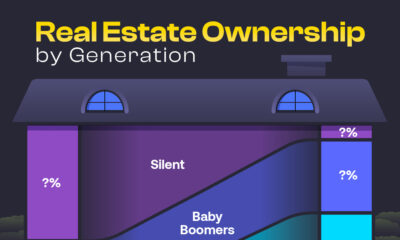
Unpacking Real Estate Ownership by Generation (1991 vs. 2025)
The Silent Generation’s share of real estate has dropped dramatically as people age, but how have Baby Boomers, Gen X, and Millennials fared?
-

Business4 months ago
America’s Economic Engines: The Biggest Industry in Every State
Real estate is the biggest industry by GDP in 26 states. Find out why it dominates—and what fuels the rest of the country.
-
Maps5 months ago
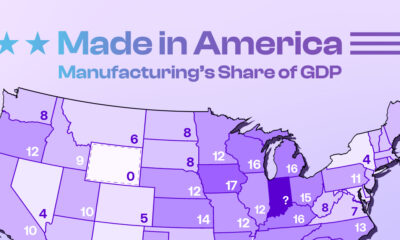
Mapped: Manufacturing as a Share of GDP, by U.S. State
Tariffs are rising to boost American-made goods. Which states gain the most—and least—from manufacturing today?
-

Technology5 months ago
Profit Powerhouses: Ranking The Top 10 U.S. Companies by Net Income
Collectively, the ten most profitable U.S. companies have a net income of $684 billion—more than the entire GDP of Belgium.
-

Money6 months ago
Millionaire Hubs: Mapping the World’s Wealthiest Cities
New York City has the highest millionaire population globally. Which other cities attract the world’s wealthiest?
-
Economy6 months ago
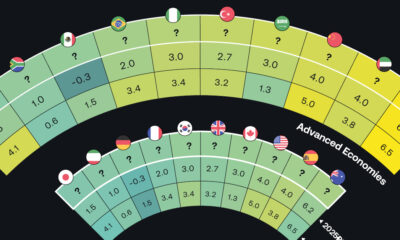
Tomorrow’s Growth: GDP Projections in Key Economies
The global economy is expected to have slighter slower growth going forward. Which countries are on track to have the biggest GDP increases?
-
Money7 months ago
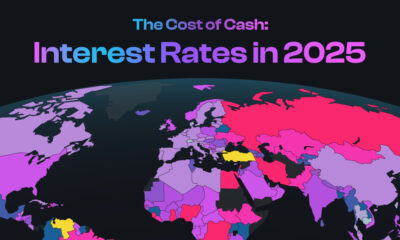
Mapped: Interest Rates by Country in 2025
The U.S. has kept their target rate the same at 4.25-4.50%. What do interest rates look like in other countries amid economic uncertainty?
-
Markets8 months ago
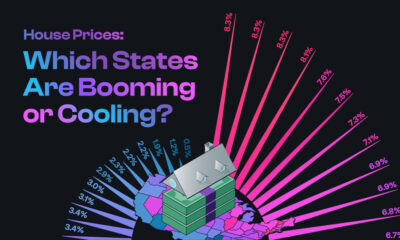
U.S. Housing Prices: Which States Are Booming or Cooling?
The national housing market saw a 4.5% rise in house prices. This graphic reveals which states had high price growth, and which didn’t.
-
Investor Education8 months ago
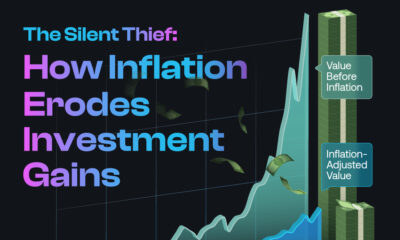
The Silent Thief: How Inflation Erodes Investment Gains
If you held a $1,000 investment from 1975-2024, this chart shows how the inflation rate can drastically reduce the value of your money.
-

Politics9 months ago
Trade Tug of War: America’s Largest Trade Deficits
Trump cites trade deficits—the U.S. importing more than it exports—as one reason for tariffs. Which countries represent the largest deficits?
Subscribe
Please enable JavaScript in your browser to complete this form.Join 375,000+ email subscribers: *Sign Up