![]()
See more visualizations like this on the Voronoi app.
Use This Visualization
U.S. Population Growth Projections to 2055
See visuals like this from many other data creators on our Voronoi app. Download it for free on iOS or Android and discover incredible data-driven charts from a variety of trusted sources.
Key Takeaways
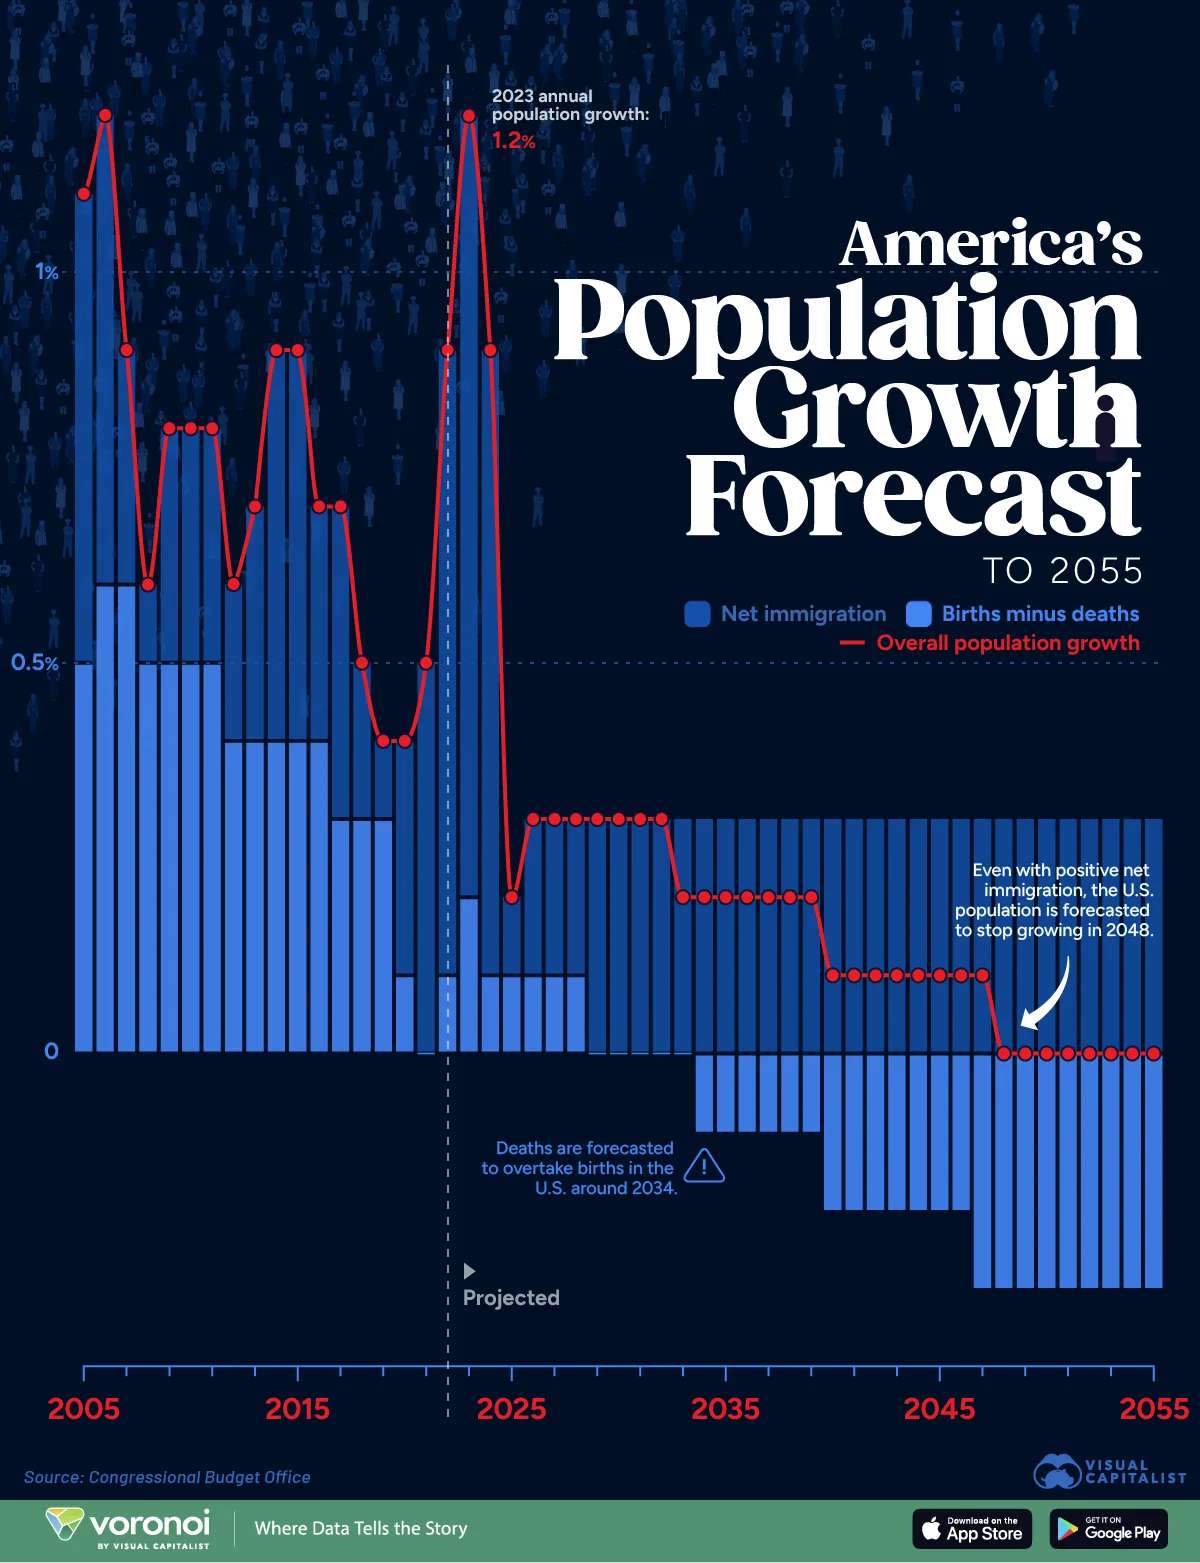
- In 2025, the U.S. population is forecast to grow 0.2% amid record-low fertility rates and an aging population.
- Over the next 30 years, population growth is expected to decline to zero.
- By 2048, population will peak, as net immigration growth and natural population decline (deaths > births) cancel each other out.
U.S. population growth is slowing, and is projected to grind to a halt by 2048.
Today, historically low fertility means births only marginally exceed deaths. Not only that, within the next decade that balance is projected to flip, with deaths surpassing births by an increasing margin.
This graphic shows U.S. population growth projections through to 2055, based on analysis from the Congressional Budget Office.
U.S. Population Growth in Decline
In the table below, we show the rate of population growth in America since 2005 along with forecasts to mid-century:
| Year | Overall Population Growth | Births Minus Deaths | Net Immigration |
|---|---|---|---|
| 2005 | 1.1% | 0.5% | 0.6% |
| 2006 | 1.2% | 0.6% | 0.6% |
| 2007 | 0.9% | 0.6% | 0.3% |
| 2008 | 0.6% | 0.5% | 0.1% |
| 2009 | 0.8% | 0.5% | 0.3% |
| 2010 | 0.8% | 0.5% | 0.3% |
| 2011 | 0.8% | 0.5% | 0.3% |
| 2012 | 0.6% | 0.4% | 0.2% |
| 2013 | 0.7% | 0.4% | 0.3% |
| 2014 | 0.9% | 0.4% | 0.5% |
| 2015 | 0.9% | 0.4% | 0.5% |
| 2016 | 0.7% | 0.4% | 0.3% |
| 2017 | 0.7% | 0.3% | 0.4% |
| 2018 | 0.5% | 0.3% | 0.2% |
| 2019 | 0.4% | 0.3% | 0.1% |
| 2020 | 0.4% | 0.1% | 0.3% |
| 2021 | 0.5% | 0.0% | 0.5% |
| 2022 | 0.9% | 0.1% | 0.8% |
| 2023 | 1.2% | 0.2% | 1.0% |
| 2024 | 0.9% | 0.1% | 0.8% |
| 2025 | 0.2% | 0.1% | 0.1% |
| 2026 | 0.3% | 0.1% | 0.2% |
| 2027 | 0.3% | 0.1% | 0.2% |
| 2028 | 0.3% | 0.1% | 0.2% |
| 2029 | 0.3% | 0.0% | 0.3% |
| 2030 | 0.3% | 0.0% | 0.3% |
| 2031 | 0.3% | 0.0% | 0.3% |
| 2032 | 0.3% | 0.0% | 0.3% |
| 2033 | 0.2% | 0.0% | 0.3% |
| 2034 | 0.2% | -0.1% | 0.3% |
| 2035 | 0.2% | -0.1% | 0.3% |
| 2036 | 0.2% | -0.1% | 0.3% |
| 2037 | 0.2% | -0.1% | 0.3% |
| 2038 | 0.2% | -0.1% | 0.3% |
| 2039 | 0.2% | -0.1% | 0.3% |
| 2040 | 0.1% | -0.2% | 0.3% |
| 2041 | 0.1% | -0.2% | 0.3% |
| 2042 | 0.1% | -0.2% | 0.3% |
| 2043 | 0.1% | -0.2% | 0.3% |
| 2044 | 0.1% | -0.2% | 0.3% |
| 2045 | 0.1% | -0.2% | 0.3% |
| 2046 | 0.1% | -0.2% | 0.3% |
| 2047 | 0.1% | -0.3% | 0.3% |
| 2048 | 0.0% | -0.3% | 0.3% |
| 2049 | 0.0% | -0.3% | 0.3% |
| 2050 | 0.0% | -0.3% | 0.3% |
| 2051 | 0.0% | -0.3% | 0.3% |
| 2052 | 0.0% | -0.3% | 0.3% |
| 2053 | 0.0% | -0.3% | 0.3% |
| 2054 | 0.0% | -0.3% | 0.3% |
| 2055 | 0.0% | -0.3% | 0.3% |
In 2024, there were 3.6 million births in America, falling from 4.1 million in 2005.
Overall, population growth from births exceeding deaths was just 0.1% last year, while in 2005 it stood at 0.5%. At the same time, fertility rates sank from 2.6 births per woman to 1.6 in 2024.
With natural increase fading, net immigration has become a far more important driver of population growth in recent years. Without it, the U.S. population would begin contracting as early as 2033.
Moreover, average population growth is projected to fall from 0.9% annually between 1974 and 2024 to less than one-fifth of that pace through 2055. Over the same period, net immigration is forecast to average 1.1 million people per year, up from 920,000 annually between 2010 and 2019.
Learn More on the Voronoi App ![]()
To learn more about this topic, check out this graphic on America’s fastest-growing states.