![]()
See more visuals like this on the Voronoi app.
Use This Visualization
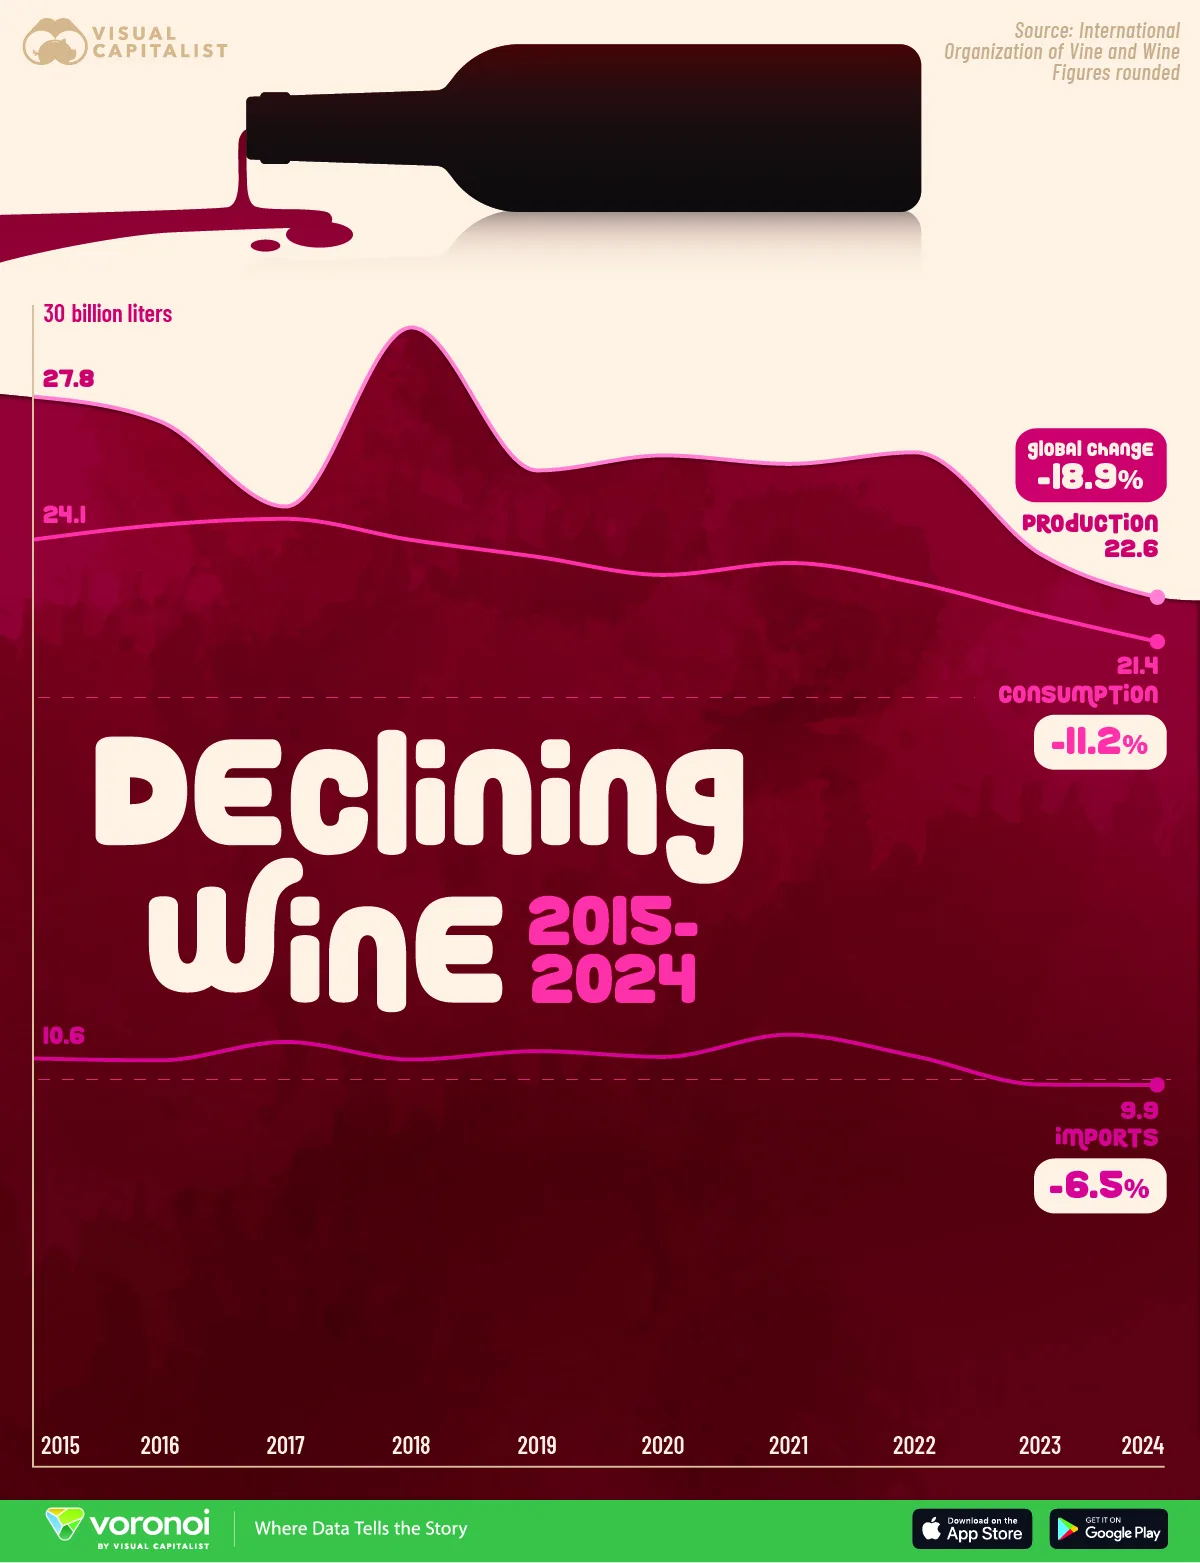
Charted: The Decline of Global Wine Production and Consumption
See visuals like this from many other data creators on our Voronoi app. Download it for free on iOS or Android and discover incredible data-driven charts from a variety of trusted sources.
Key Takeaways
- Global wine production fell nearly 19% between 2015 and 2024, reaching its lowest level in a decade.
- Wine consumption also declined during the period.
Wine production and consumption have entered a sustained decline over the last decade. This chart tracks how global wine output, consumption, and trade have evolved since 2015.
The data for this visualization comes from the International Organisation of Vine and Wine (OIV). It tracks production, consumption, and imports from 2015 through 2024, measured in billions of liters.
Wine Production Hits a Decade Low
Global wine production peaked intermittently during the late 2010s, reaching nearly 30 billion liters in 2018.
Since then, output has steadily fallen, dropping to just 22.6 billion liters in 2024. That represents an almost 19% decline over the nine-year period.
| Year (billions of liters) | Global wine production | Global wine consumption | Global wine imports |
|---|---|---|---|
| 2015 | 27.83 | 24.11 | 10.60 |
| 2016 | 27.19 | 24.49 | 10.55 |
| 2017 | 24.97 | 24.65 | 11.03 |
| 2018 | 29.63 | 24.10 | 10.57 |
| 2019 | 25.91 | 23.66 | 10.79 |
| 2020 | 26.30 | 23.19 | 10.64 |
| 2021 | 26.08 | 23.50 | 11.22 |
| 2022 | 26.38 | 22.99 | 10.66 |
| 2023 | 23.73 | 22.15 | 9.92 |
| 2024 | 22.56 | 21.41 | 9.91 |
| % Change 2015 to 2024 | -18.9% | -11.2% | -6.5% |
Extreme weather events, including droughts, heatwaves, and late frosts, have disrupted harvests in major wine-producing regions. At the same time, rising costs and tighter environmental regulations are adding pressure to growers worldwide.
Consumption Declines More Gradually
While production has fallen sharply, global wine consumption has declined at a slower pace. Total consumption dropped from about 24.1 billion liters in 2015 to 21.4 billion liters in 2024, a decline of roughly 11%.
Health-conscious lifestyles, aging populations in traditional wine markets, and younger consumers drinking less alcohol overall are contributing factors.
Global Trade Shows Signs of Softening
Wine imports have also edged lower, falling about 6.5% over the same period.
After peaking above 11 billion liters in the early 2020s, global wine trade slipped below 10 billion liters by 2023 and 2024.
Learn More on the Voronoi App ![]()
If you enjoyed today’s post, check out Ranked: Which Country Consumes the Most Coffee? on Voronoi, the new app from Visual Capitalist.