Published
32 mins ago
on
February 23, 2024
| 47 views
-->
By
Katie Jones
Graphics & Design
- Alejandra Dander
The following content is sponsored by Carbon Streaming
Note: This infographic contains forward looking information based on current expectations and beliefs of Carbon Streaming Corporation. For further information about the risks, uncertainties and assumptions related to such forward looking information, please see their legal notice.
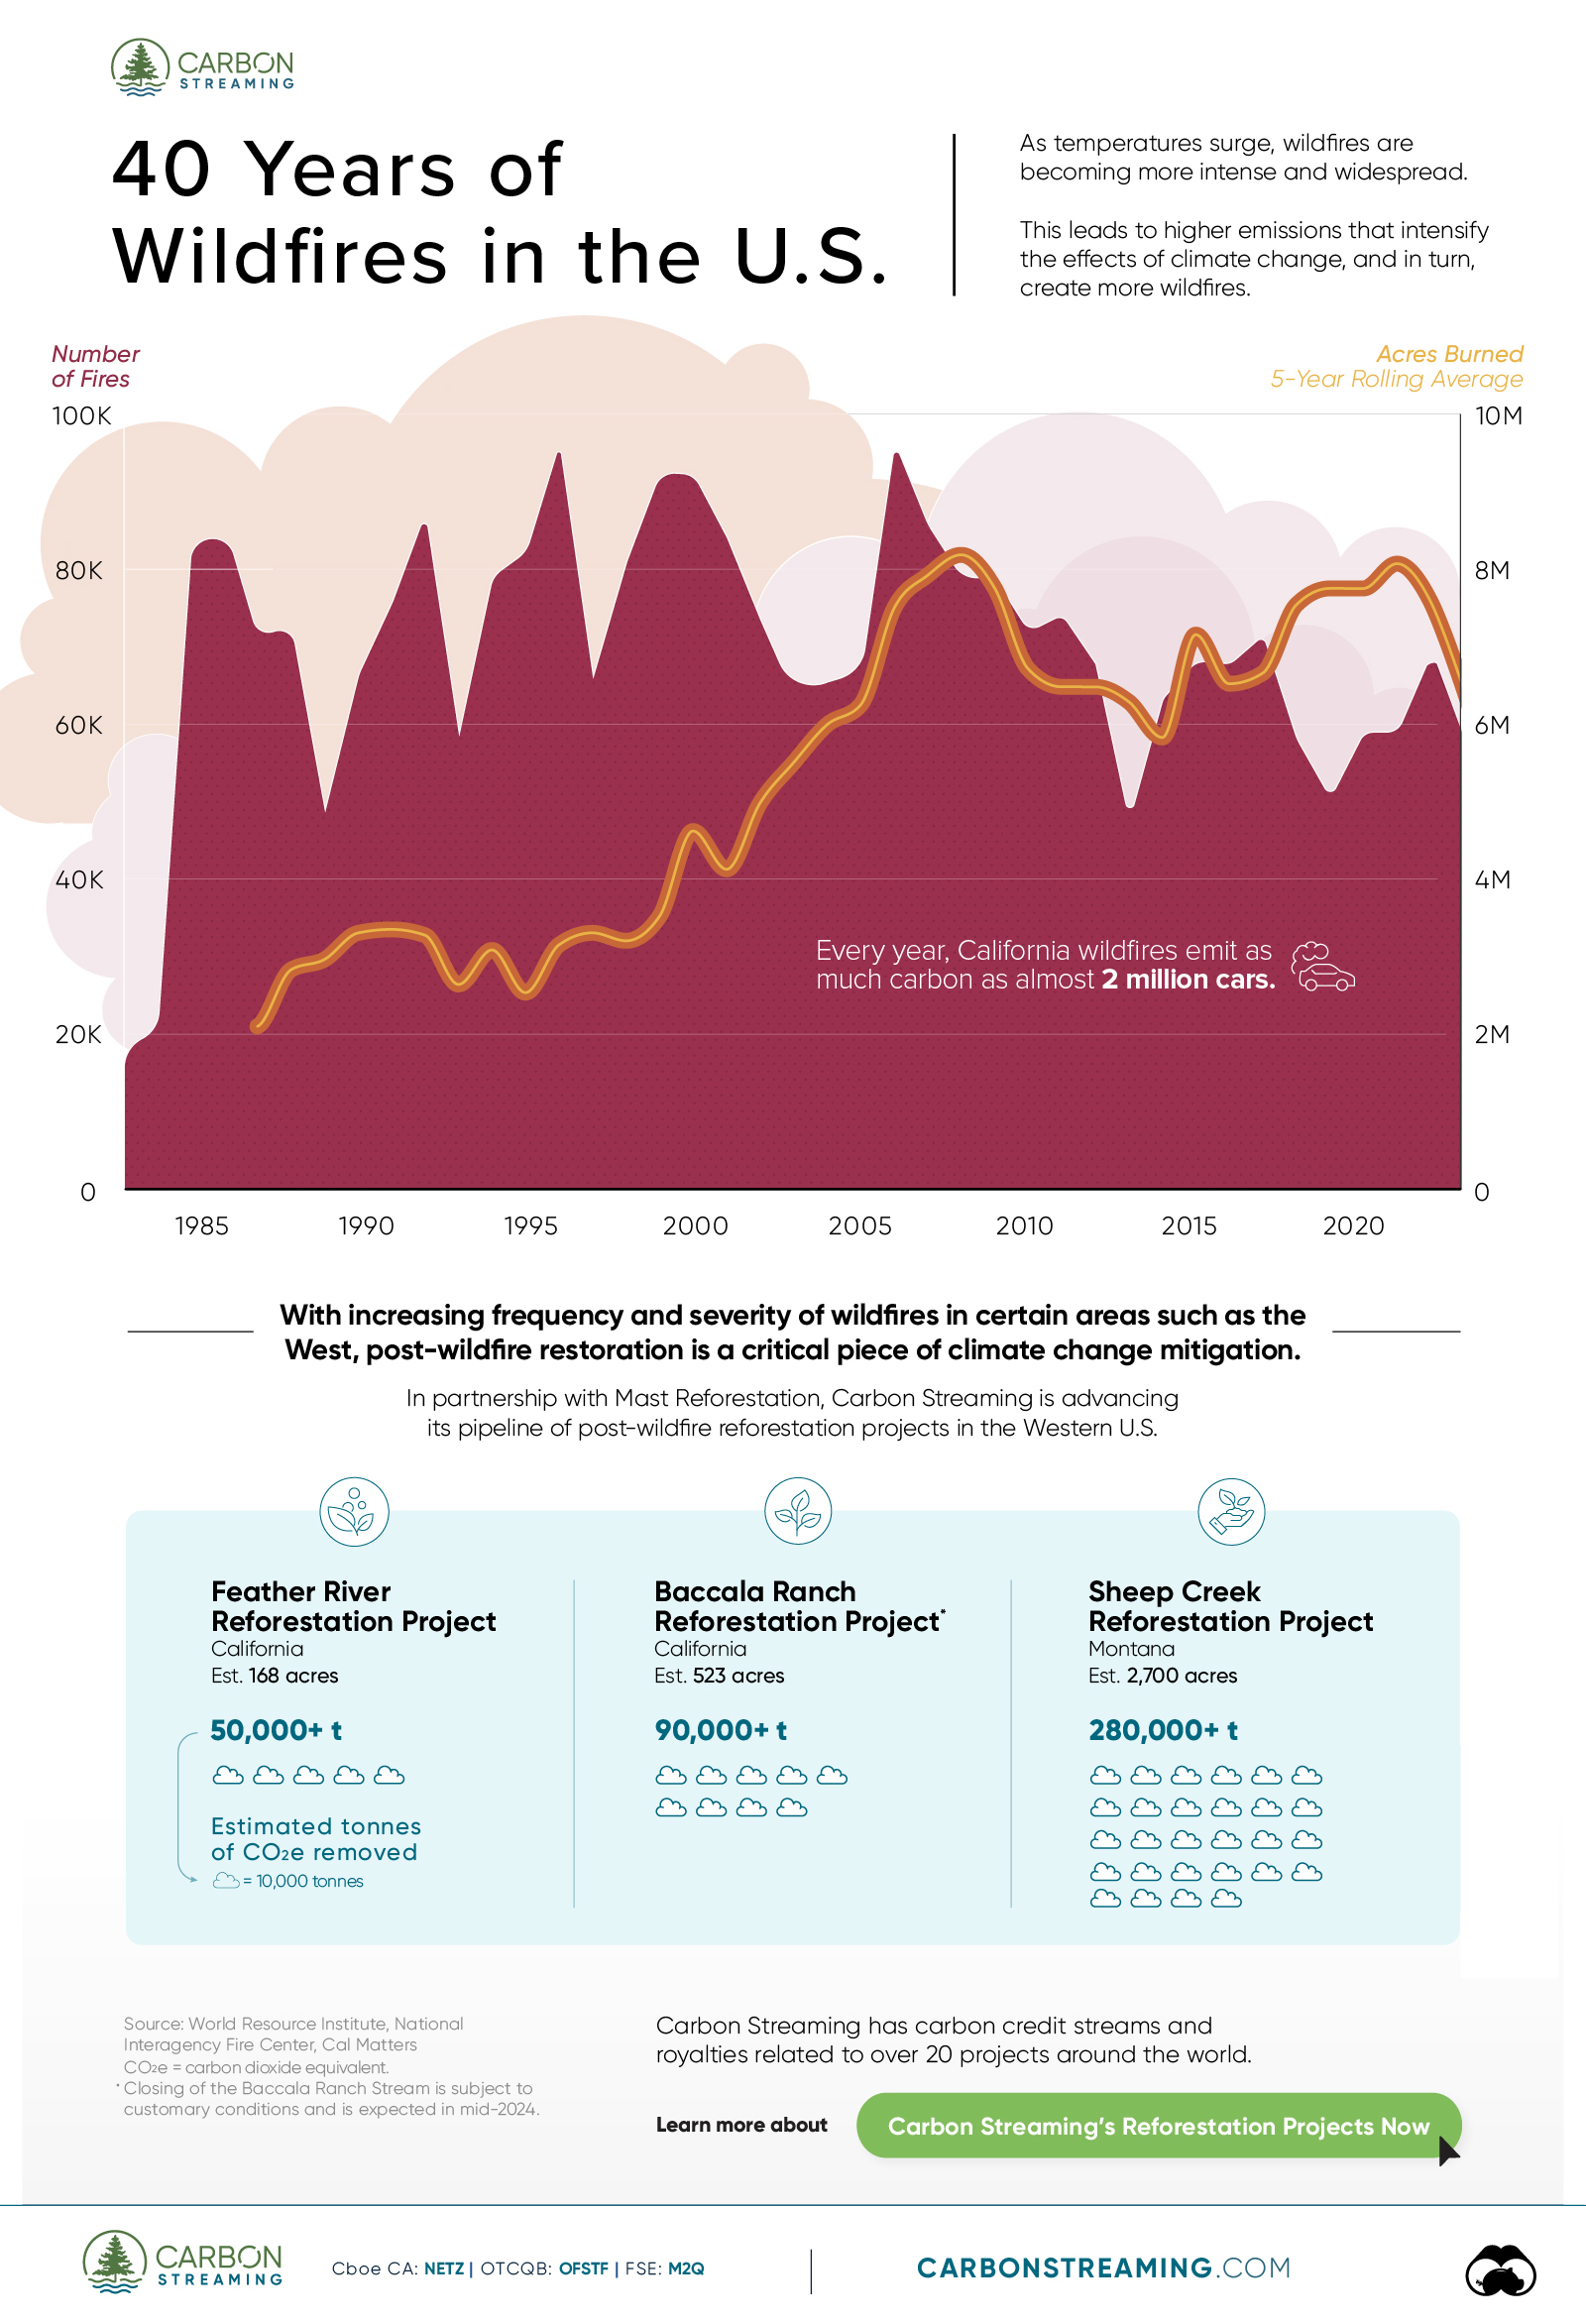
40 Years of U.S. Wildfires, in One Chart
Wildfires are becoming more intense and widespread—largely due to rising temperatures caused by climate change.
What’s more, experts predict a whopping 50% surge in wildfires by 2100.
We partnered with Carbon Streaming to illustrate four decades (1983–2023) of wildfire activity in the U.S. Let’s dive in.
The Evolution of Wildfires Over Time
The data we used comes from the National Interagency Fire Center and highlights the number of wildfires that occurred between 1983 and 2023, along with the average acres burned over the same time period. The 5-year rolling average was calculated based on the current year plus the preceding four years.
As the table below shows, the total area burned across the U.S. in 2023 was significantly below average, and the number of wildfires was slightly below average due in part to cooler weather conditions.
| Year | Number of Wildfires | Acres Burned | 5-Year Rolling Average |
|---|---|---|---|
| 2023 | 56,580 | 2,693,910 | 6,436,687 |
| 2022 | 68,988 | 7,577,183 | 7,651,404 |
| 2021 | 58,985 | 7,125,643 | 8,141,184 |
| 2020 | 58,950 | 10,122,336 | 7,818,055 |
| 2019 | 50,477 | 4,664,364 | 7,818,617 |
| 2018 | 58,083 | 8,767,492 | 7,604,867 |
| 2017 | 71,499 | 10,026,086 | 6,715,278 |
| 2016 | 67,743 | 5,509,995 | 6,575,308 |
| 2015 | 68,151 | 10,125,149 | 7,215,583 |
| 2014 | 63,312 | 3,595,613 | 5,875,098 |
| 2013 | 47,579 | 4,319,546 | 6,340,332 |
| 2012 | 67,774 | 9,326,238 | 6,534,917 |
| 2011 | 74,126 | 8,711,367 | 6,535,278 |
| 2010 | 71,971 | 3,422,724 | 6,767,754 |
| 2009 | 78,792 | 5,921,786 | 7,821,087 |
| 2008 | 78,979 | 5,292,468 | 8,256,305 |
| 2007 | 85,705 | 9,328,045 | 7,989,980 |
| 2006 | 96,385 | 9,873,745 | 7,561,314 |
| 2005 | 66,753 | 8,689,389 | 6,300,747 |
| 2004 | 65,461 | 8,097,880* | 6,041,568 |
| 2003 | 63,629 | 3,960,842 | 5,547,210 |
| 2002 | 73,457 | 7,184,712 | 5,020,983 |
| 2001 | 84,079 | 3,570,911 | 4,155,432 |
| 2000 | 92,250 | 7,393,493 | 4,654,449 |
| 1999 | 92,487 | 5,626,093 | 3,543,860 |
| 1998 | 81,043 | 1,329,704 | 3,233,357 |
| 1997 | 66,196 | 2,856,959 | 3,326,931 |
| 1996 | 96,363 | 6,065,998 | 3,169,525 |
| 1995 | 82,234 | 1,840,546 | 2,547,041 |
| 1994 | 79,107 | 4,073,579 | 3,103,256 |
| 1993 | 58,810 | 1,797,574 | 2,654,002 |
| 1992 | 87,394 | 2,069,929 | 3,296,346 |
| 1991 | 75,754 | 2,953,578 | 3,371,819 |
| 1990 | 66,481 | 4,621,621 | 3,324,936 |
| 1989 | 48,949 | 1,827,310 | 2,979,841 |
| 1988 | 72,750 | 5,009,290 | 2,844,061 |
| 1987 | 71,300 | 2,447,296 | 2,106,936 |
| 1986 | 85,907 | 2,719,162 | N/A |
| 1985 | 82,591 | 2,896,147 | N/A |
| 1984 | 20,493 | 1,148,409 | N/A |
| 1983 | 18,229 | 1,323,666 | N/A |
*2004 fires and acres do not include state lands for North Carolina
What’s the impact of the increasing burned areas and severity of wildfires over time?
Simply put, when wildfires burn, they release smoke and gas into the air which makes the Earth warmer, making it easier for more wildfires to start and spread. This cycle is often referred to as the fires and climate feedback loop, and is the reason why experts believe that wildfires will only continue to worsen.
Wildfire Havoc in the West
2023 marked a year of severe wildfire destruction on the West Coast and in Hawaii. The Maui wildfires in August, for example, led to the destruction of 2,308 structures and at time of writing, 5,000 residents are still displaced six months later. Additionally, the cost of rebuilding Maui could exceed $5 billion and take several years.
Post-wildfire restoration is a critical piece of climate change mitigation, particularly in the states that need it the most.
What Can Be Done?
In partnership with Mast Reforestation, Carbon Streaming is advancing its pipeline of post-wildfire reforestation projects in Western U.S. states.
To date, Carbon Streaming has entered into carbon credit streams to provide funding for three reforestation projects—Sheep Creek in Montana and Feather River and Baccala Ranch in California. Mast Reforestation’s unique approach combines proven reforestation practices with new technology to regrow resilient, climate-adapted forests. Want to know more?
![]()
Learn more about Carbon Streaming’s Reforestation Projects

Please enable JavaScript in your browser to complete this form.Enjoying the data visualization above? *Subscribe
Related Topics: #west coast #Carbon Streaming #reforestation #wildfires #climate change #california #united states
Click for Comments
var disqus_shortname = "visualcapitalist.disqus.com";
var disqus_title = "40 Years of U.S. Wildfires, in One Chart";
var disqus_url = "https://www.visualcapitalist.com/sp/40-years-of-u-s-wildfires-in-one-chart/";
var disqus_identifier = "visualcapitalist.disqus.com-164506";
You may also like
-

Environment6 days ago
Charted: Share of World Forests by Country
We visualize which countries have the biggest share of world forests by area—and while country size plays a factor, so too, does the environment.
-

Energy3 weeks ago
2024 U.S. Clean Electricity Outlook
In this graphic, we explore the projected generation capacity of different clean electricity technologies in the U.S. for 2023 and 2024.
-

Green3 weeks ago
Chart: Is ESG Investing in Decline?
After the pandemic boom, ESG investments lost their luster amid high interest rates. Could they make a comeback?
-

Green4 weeks ago
Which Countries Have the Largest Forests?
Together, the top five countries with the largest forests account for more than half of the world’s entire forest cover.
-

Energy4 weeks ago
Visualizing All the Nuclear Waste in the World
Despite concerns about nuclear waste, high-level radioactive waste constitutes less than 0.25% of all radioactive waste ever generated.
-

Green1 month ago
Every EV Qualified for U.S. Tax Credits in 2024
The number of EVs eligible for U.S. tax credits dropped sharply in 2024. Here is every model that qualifies.
Subscribe
Please enable JavaScript in your browser to complete this form.Join the 375,000+ subscribers who receive our daily email *Sign Up
The post 40 Years of U.S. Wildfires, in One Chart appeared first on Visual Capitalist.