
Authored by Sven Henrich via NorthmanTrader.com,
Record prices continue to be printed on US indices as the global multiple expansion on the heels of still ongoing record central bank intervention has yet to slow down in a significant way.
All central banks were in essence dovish in recent days and weeks, whether the FOMC, the ECB, the BOE and of course the ever active BOJ as well as the SNB as it showed a new record $88B in direct holdings of US stocks.
Yet, despite the record prices on indices, the rally appears to be deflating from within.
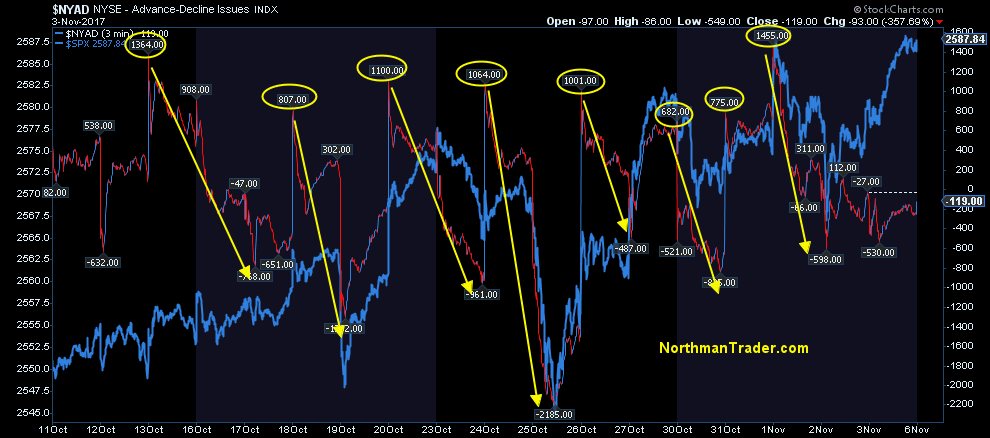
In the past several weeks I’ve pointed out a very specific pattern of positive internals on market opens and then a very distinct pattern of internals weakening throughout most days:
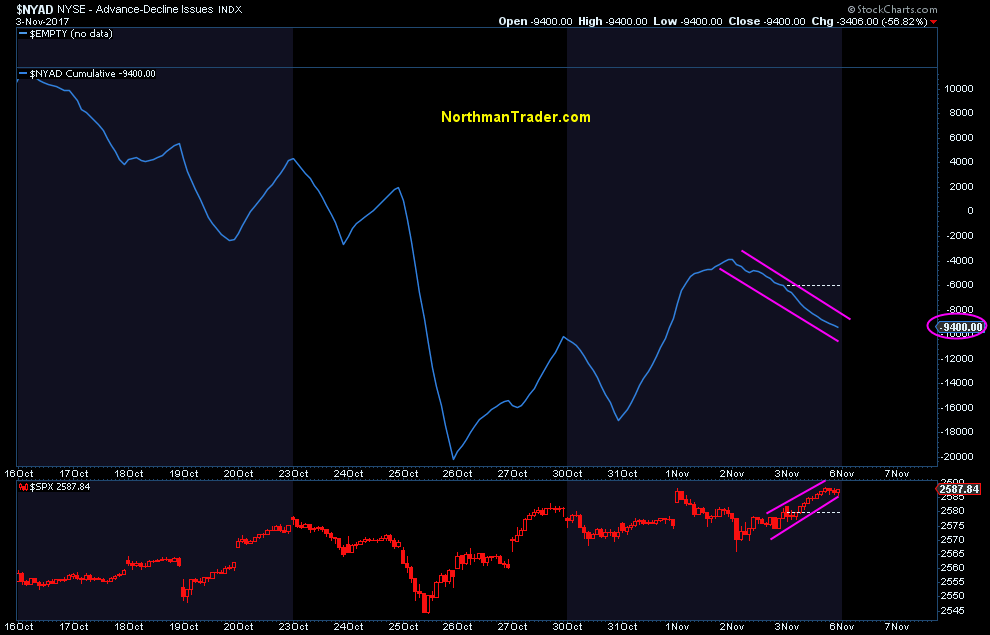
This trend has impacted the cumulative advance/decline picture and shows that recent highs have come on a negative cumulative advance/decline:
Since this rally began with massive global central bank intervention in February 2016 the cumulative advance/decline picture has often been cited as a sign of underlying core strength in markets. This picture has changed:
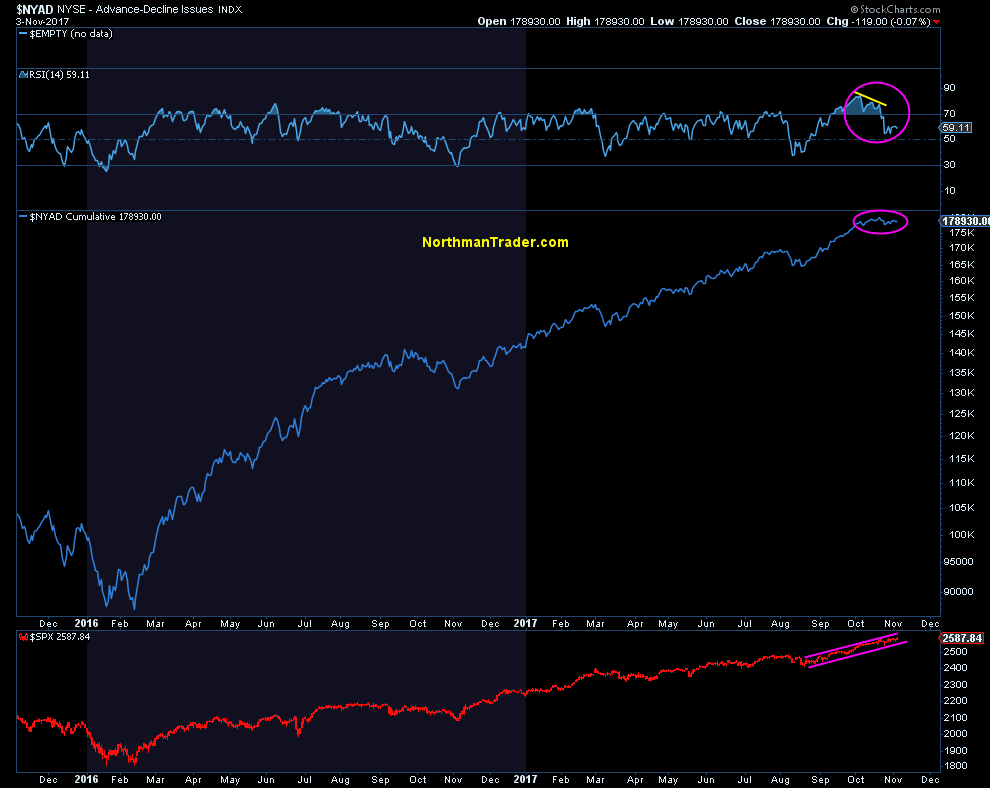
Recent highs came on negative divergences in relative strength despite index prices continuing to advance in a seemingly steady trend.
Yet the internal picture is practically collapsing.
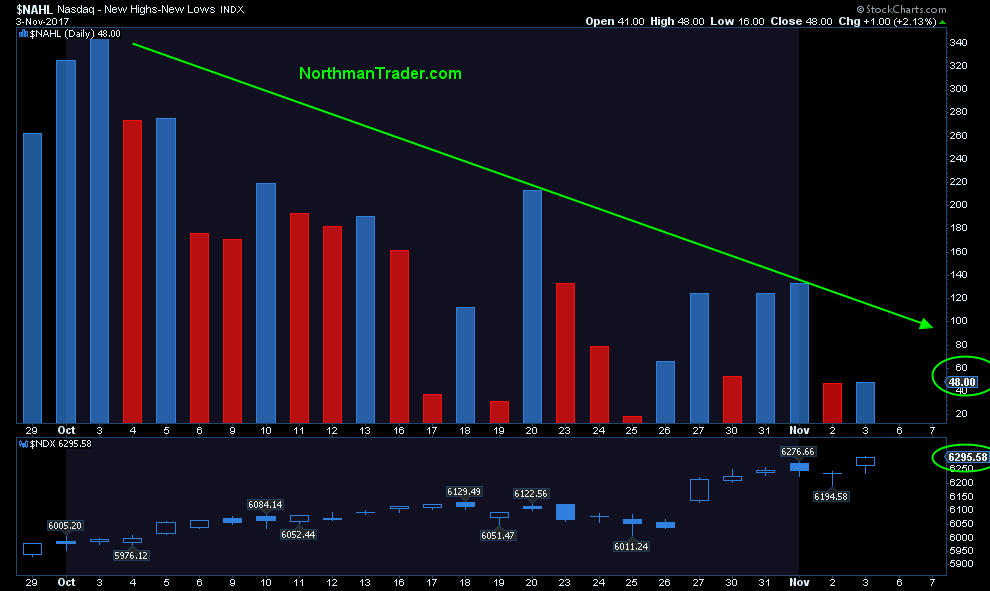
Take the recent highs in the Nasdaq.
Ever since the beginning of October all new highs in the $NDX have come on fewer new highs versus new lows. Indeed Friday’s $NDX highs came on the lowest expansion yet:
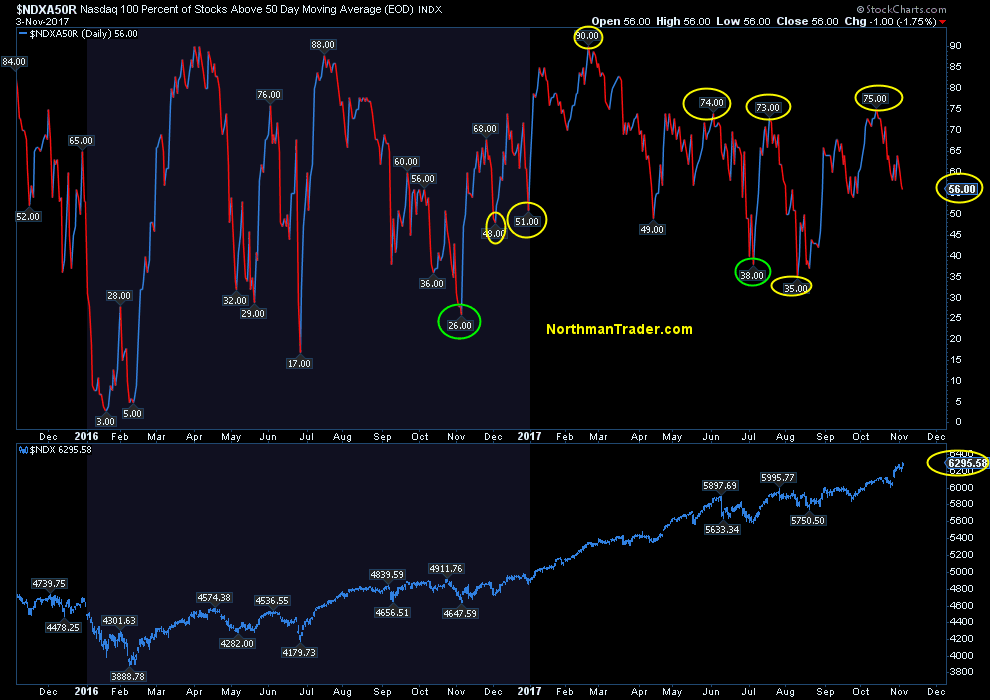
On $NDX itself we can observe a complete collapse in the amount of stocks above the 50MA as $NDX printed new highs. Only 56% of components are still above the 50MA:
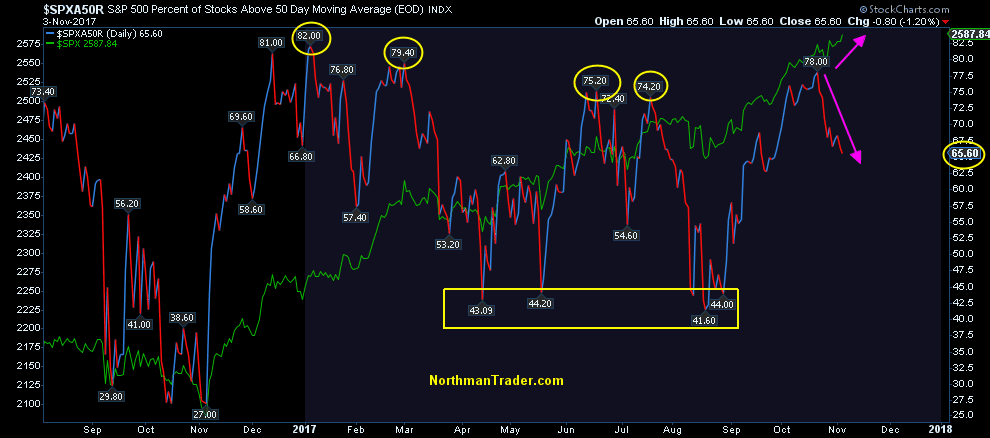
A similar picture can be observed on the $SPX:
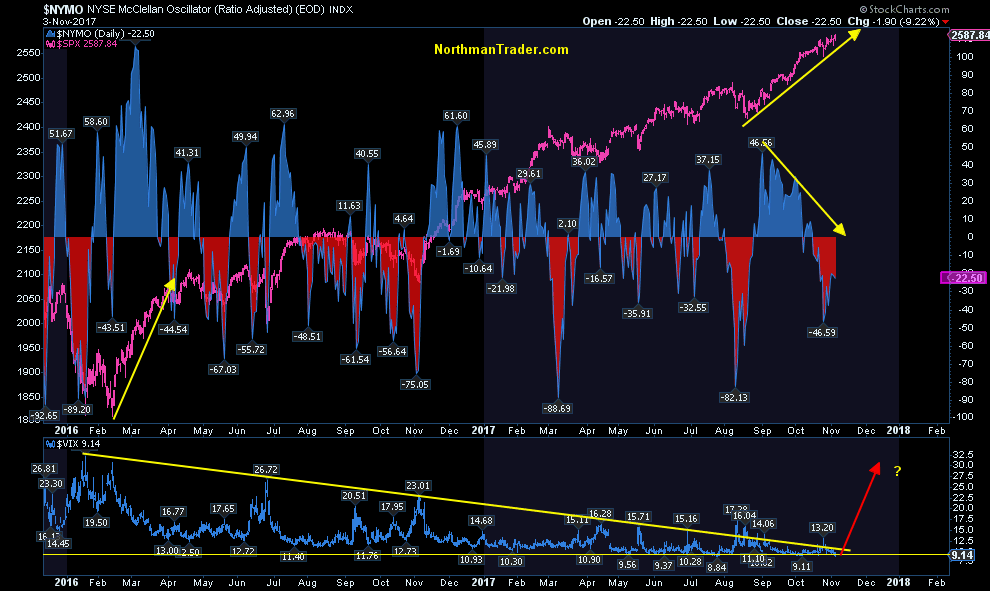
And of particular note: All recent highs have come on a negative $NYMO:
The message: Somebody is selling this market. Every day. And it’s very cleverly done as to not disturb the seeming tranquility in markets.
Note that despite all the selling volatility compression continues at a record pace as during each Friday, no matter what happens in the world, the $VIX is ensured a close below 10 by week’s end:
Friday $VIX closing prices for the past 7 weeks:11/03 9.1410/27 9.8010/20 9.9710/13 9.6110/06 9.6509/29 9.5109/22 9.59
— Sven Henrich (@NorthmanTrader) November 5, 2017
You’d think we’d have more volatility with such an internal breakdown in stocks. But the concentration of market cap in only a handful of stocks continues to mask the selling underneath.
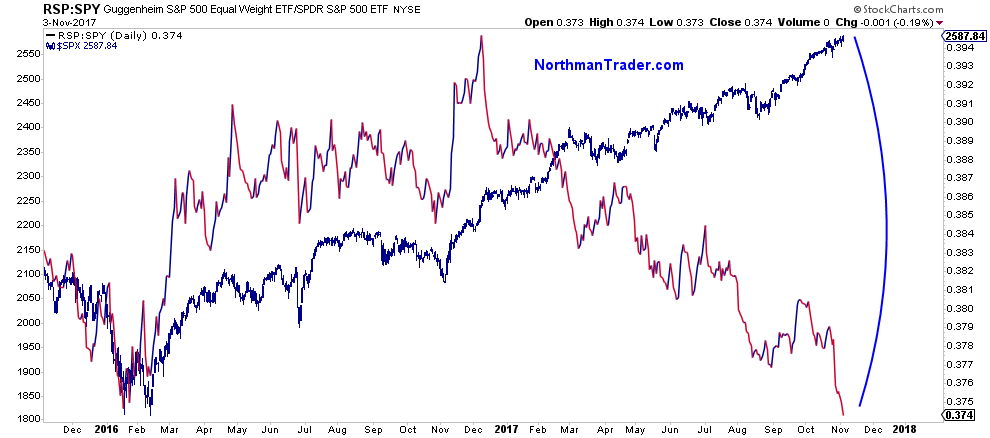
On an equal weight basis we’ve noted the divergence in markets for quite some time. This indicator has now fallen off the cliff as the correlation has completely broken down:
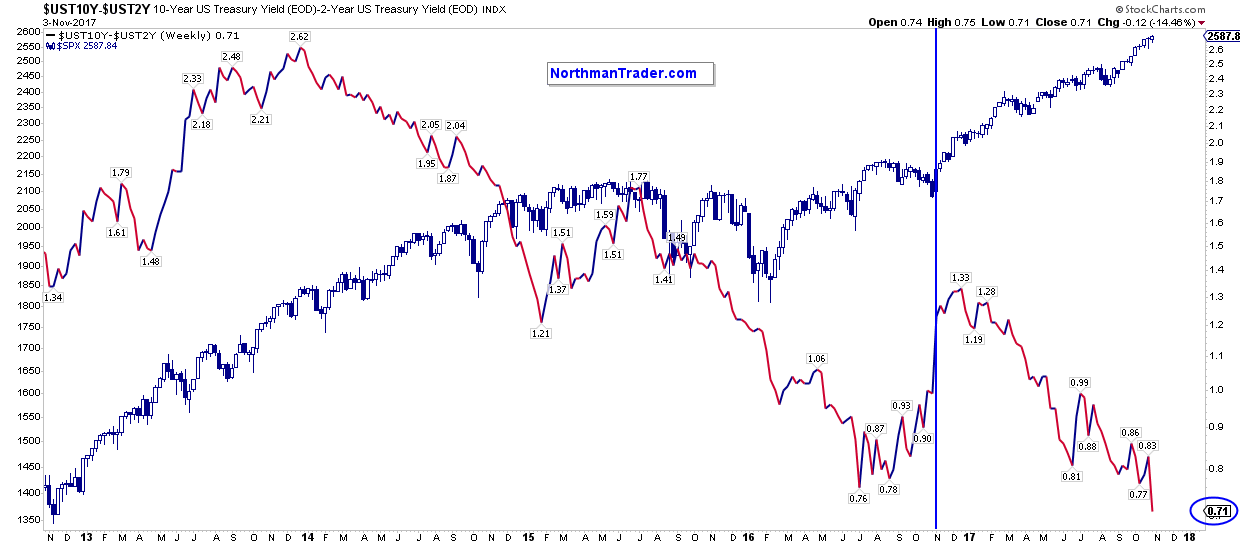
As has the yield curve which hasn’t believed in this rally in months:
2017 has seen more central bank intervention on a global basis than ever. But this party is slowly coming to an end. And while central banks will still intervene in 2018 it will be at a reduced pace. The last time we’ve seen central banks intervene at a reduced pace? 2015. And it produced sizable selling in the summer of 2015 and at the beginning of 2016 forcing record intervention since then.
All global markets have proven is that they can perform splendidly with record intervention:

2018 will then be a test case how well markets can fare with less than record intervention, a new reality. Another new reality: Soon US markets will also have their answer in regards to tax cuts. All will be priced in one way or the other.
And, from the looks of it, someone has begun selling ahead of both of these emerging realities. And once the rest of the market takes notice we suspect Friday $VIX closes below 10 may suddenly become a thing of the past.